The new website Brandtoys has introduced what they are claiming is the world's first visualization engine to assess and compare consumer sentiment and the online buzz of brands. The visualization takes the shape of a whimsical character whose physical attributes, (color, shape, size of ears, size of legs, and even surrounding climate), are determined by Brandtoys using source data from consumer surveys and from mining mentions of the brand on the social web.
The idea being, for example, the more online chatter and buzz about a given brand, that brand's character will be portrayed with large ears; if the online sentiment surrounding a brand skews negative, (think BP), then it will be 'raining' on the brand's character.
To get a better idea of how this visualization works, take a look at the character for BP, pretty much a globally maligned brand stemming from 2010's Gulf Oil Spill and BP's subsequent handling of the crisis:
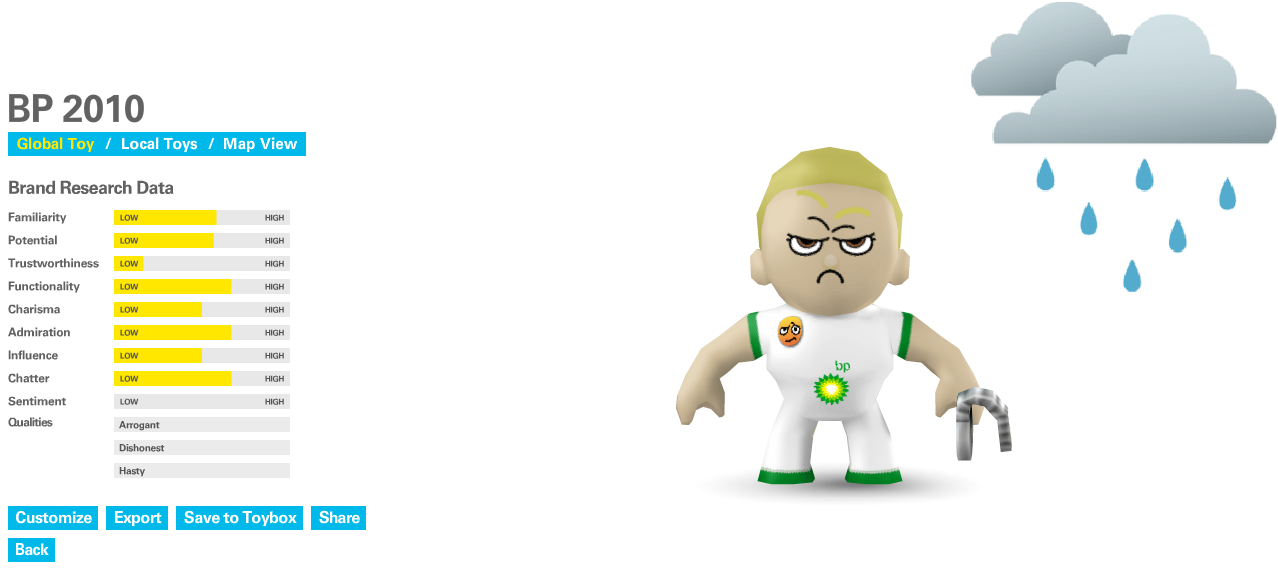
Sort of what you'd expect - BP is characterized as a petulant, angry figure with an aggressive stance, and in the end appears totally unsympathetic or approachable. Persistent (and deserved) negative sentiment about BP produces the rain clouds above our little friend's head.
Big deal, you may think, who needs a funny character to know that most people don't think all that highly of BP at the moment. But where the Brandtoys approach to the presentation of consumer and online sentiment data is more compelling is in the comparison of competing or adjacent brands (and their derived characters). Then the differences seem to be a bit more subtle and interesting.
Have a look at the comparison of three similar brands - Miller Lite, Budweiser, and Heineken:

While the character manifestations of each character are broadly similar, there are a few noticeable and striking differences, the Miller Lite character has much larger ears, signifying a high level of chatter and conversation about the brand; the Budweiser character's eyes are shut, indicating relatively low scores for brand 'charisma'. For a branding or marketing professional, 'seeing' these difference portrayed in this manner is got to be far more resonant than scanning a column of figures on a spreadsheet.
But beyond being a cool, quirky, and kind of fun site to play around on (I dare you to not spend 5 or 10 minutes creating your own characters), the Brandtoys team emphasizes that the characters are backed by solid and ample hard data and analysis. The larger point to me, and why I decided to write about this site today, is that it reinforces the potential that we have in presenting data in new and innovative ways, ways that can help tell a story, that can enlighten and engage an audience, and are simply a heck of a lot more interesting than another spreadsheet or Powerpoint presentation.
We have lots and lots of data. You business leaders are likely overwhelmed with the endless barrage of messages they receive each day.
What can you do to make your message and the information you are trying to communicate stand out?
Maybe presenting your analysis with the assistance of a goofy red gorilla is not such a bad idea after all.