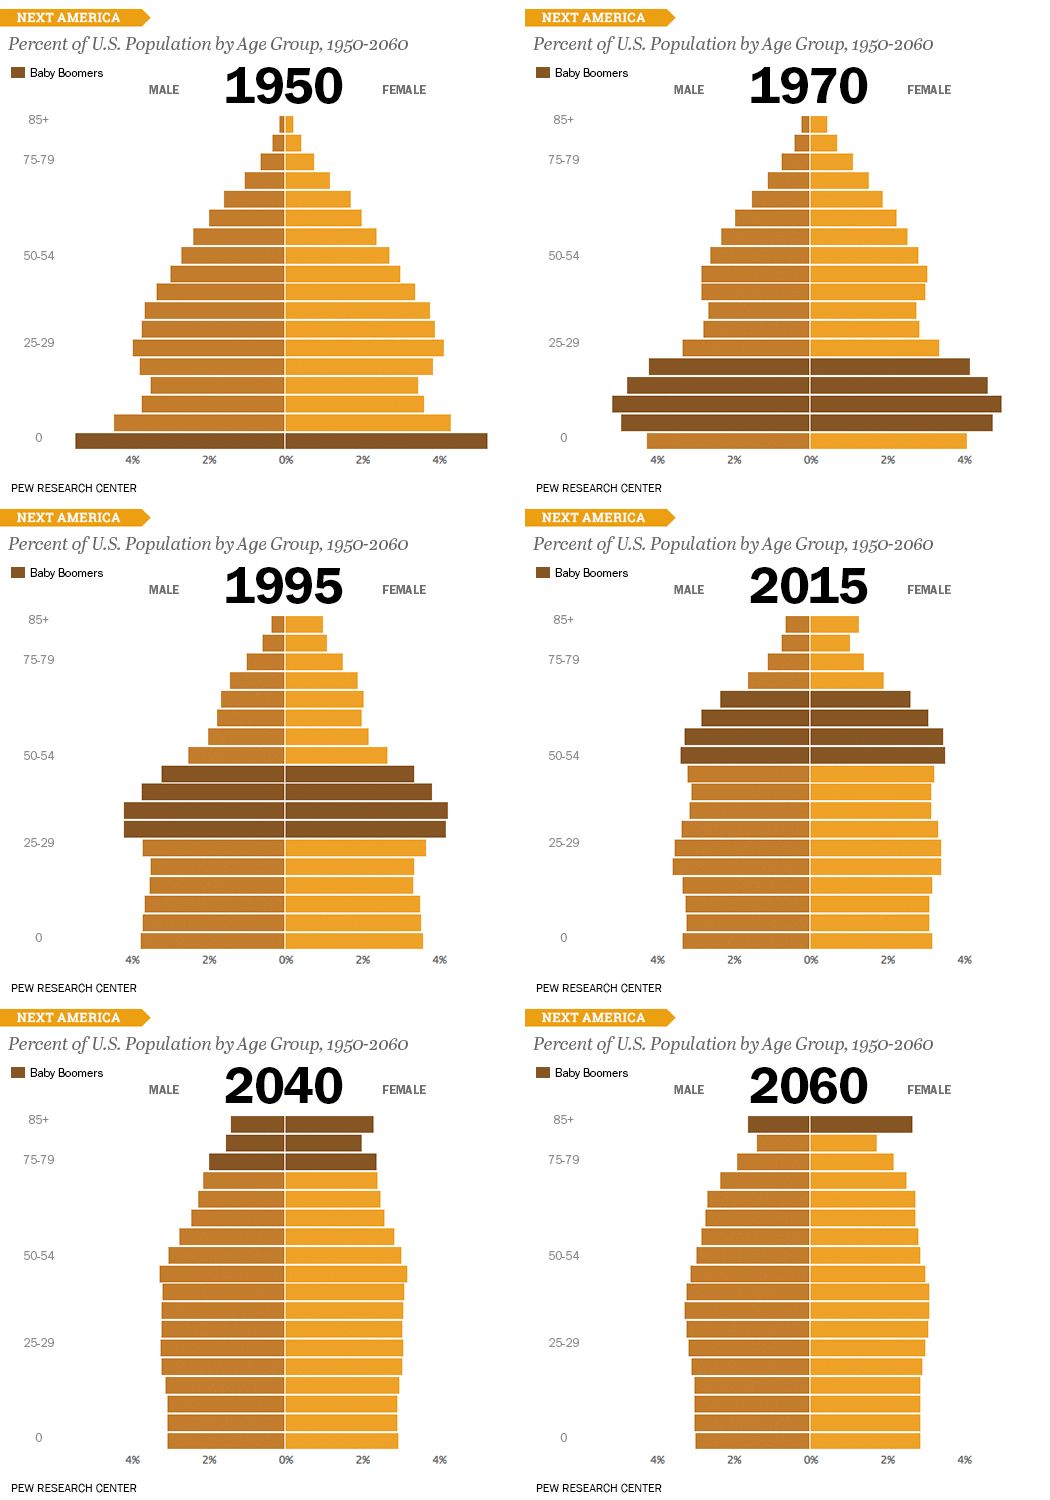
I know I have posted a few times previously on the how the population in general is getting older on average, and how of course as an after-effect of this general trend we will begin (if we have not already), to see our workforce getting older as well. But risking overkill on the subject, I wanted to share a really cool GIF (a first for the CHART OF THE DAY here), on what this graying of the population looks like over time, courtesy of a cool visualization from The Atlantic.
Take a look at the GIF below (try not to get dizzy), of the standard population pyramid that charts the percentage of a population by age group, and you can get a feel for how this aging trend is playing out. Of course as always, a few FREE comments from me after the chart. Email and RSS subscribers may need to click through.

Pretty neat, right? And you can see in the darker colored rectangles moving up the chart the effects (and the size) of the Baby Boom generation that comes on to the scene in about 1950 or so, and over time climbs the population pyramid while fundamentally changing its shape from a classic pyramid with larger percentages of younger folks forming the base, into more of a rectangle.
What are the most important workplace implications of an increasingly aging population?
1. The obvious one - we will have more older workers in our organizations than in the past. This will be not just because people will want or will have to work later in life than in the past, it will be a matter of necessity, as the available candidate pools for jobs will age right in step with the general population. HR pros and recruiters will have to look at say 50+ year-old candidates with a different perspective. These folks might typically have 10-15 more working years left than a similar candidate would have in the recent past.
2. Work and workplaces will have to adapt to more older workers. That could mean redesigning work stations and processes to make them more older-worker friendly, modifying work schedules to accommodate some older workers need or desire for lighter schedules, and taking a more thoughtful approach to things like benefits programs and design to better meet older workers expectations. It seems likely that the more successful organizations will not just recognize this trend, they will make strategic decisions to better position themselves to thrive in this new paradigm.
3. Increased rate of retirements. Although many older people will continue to work later in life, of course many will not, and most organizations can expect to see a rise in the rate of retirements as the baby boom finally begins exiting the workforce en masse in the next few years. This is kind of the most basic or first step in any workforce planning exercise, and if you have not already taken a look at the important functional areas, important skill sets, and localized regions of your workforce and taken an initial estimate of replacement needs due to anticipated increased retirements, then you probably need to start that project today. For many skills and locations, an uptick in retirements combined with a shallow candidate pool will place a strain on your ability to keep staff at needed/desired levels to meet your business objectives.
That's it - I'm out. Thanks for playing along with the Chart of the Day on a Monday.
Have a great week!