There are only two websites you need. Actually three, if you count this one. And hint, none of them are Facebook. I promise you that one day you will regret all the time you wasted with Facebook. But I digress.
One is BLS.gov, the Bureau of Labor Statistics site where all the employment, industry, productivity, time use, compensation (and more) information you need on the US labor force is located.
The other is the Federal Reserve of St. Louis' fantastic FRED site, where you can download, graph, and track over 500,000 data series covering the economy, employment, demographics and much, much more. Data geeks like me can get lost in the FRED site for hours.
I was using these two sources to update my notes and perspective on US aggregate employment across industry groups, useful information that helps me guide and shape the specific industry focus that results in both the content for this blog, topics for the HR Happy Hour Podcast, and the program for the HR Technology Conference.
This data is also useful to consider in a larger sense - like when thinking about governmental policies and investments, the focus of secondary and higher education and training, and even when answering questions like 'Just what is our country good at?' from a business/economy perspective.
Have a look at today's Chart of the Day - (built at the FRED site) aggregate US employment since 1980 in the largest category components of the labor force, then some comments from me..

We all know that 100 - 120 years ago the US shifted from a largely agricultural economy/labor force to a manufacturing, shipping, and trading workforce. And then, slowly but surely, beginning in about 1980, a shift started to occur. Manufacturing employment began to decline while professional services, health care, and retail began to climb.
Here's the snapshot of latest employment numbers for the categories in chart, (Nov 2017).
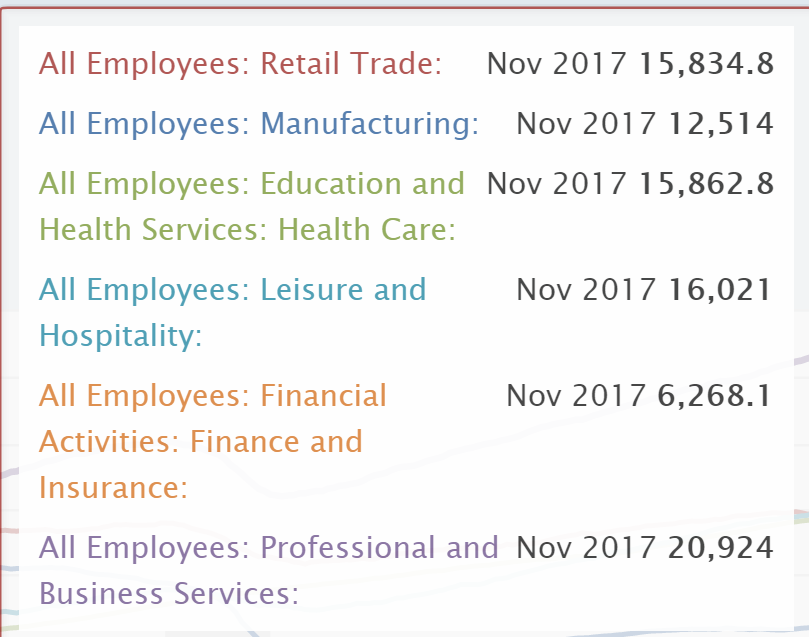
Manufacturing, while pretty apparent to most casual labor market observers, has fallen below professional services, health care, leisure and hospitality, even retail employment in terms of its overall share of US employment. For some perspective, as of November 2017 total US non-farm employment was about 149 million. At that level, manufacturing now represents only about 8.5% of US employment.
In terms of where most observers see these trends continuing out into the future, the aging US population seems to clearly indicate that health services and health care will be the largest growth area moving forward. Retail jobs are under threat from automation, online shopping (and the efficiencies and lower labor costs associated), and by the constant chase for less expensive goods produced and shipped in lower cost countries. The same threats also impact manufacturing. Even the largest, new manufacturing plants require far fewer workers than the ones of just 10 - 20 years ago.
There's lots more to think about when looking at this data. I encourage anyone interested to join me in a deep dive on BLS.gov and the St. Louis FRED.