Today's Chart of the Day comes from our friends at the Bureau of Labor Statistics from their recent American Time Use Survey, which collects information about the activities people do during the day and how much time they spend doing them.
So what do most of us (employed people ages 25 - 54 who have kids under 18 at home) do all day, or at least all 'work' day? Here is the chart and some FREE comments (lamentations) from me after the data:
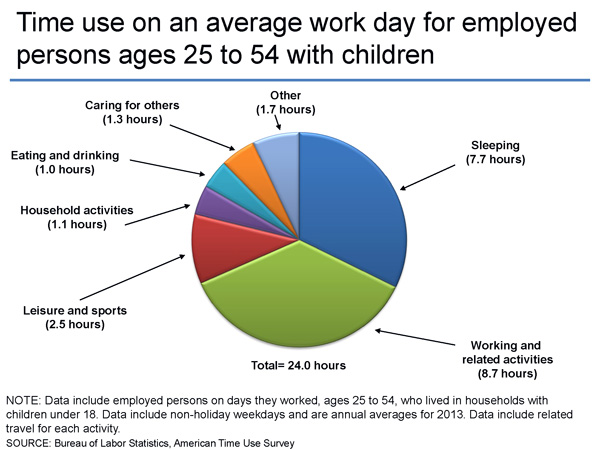
A few things stand out really quickly from this data of the average 24-hour work day:
1. While the average person sleeps just a shade under 8 hours a day, I don't know anyone that is likely to report that much sleep. It seems like most folks I know are maybe getting 6.5 or 7 hours a night. So the 7.7 seems really high, what do you think?
2. The single largest slice of the average day, unsurprisingly, is work (and related activities including commuting from/to work), with 8.7 hours per day spent. That kind of seems in line to me although I bet if you ask around your circle of friends and colleagues most people will say they work more than that. I kind of think there could be some fudging in both the survey numbers and what folks talk about privately as well. We like to think we work more than we do, but come on, are you really grinding away 10 or 12 hours a day like you would like (certain) people to believe?
3. The most interesting thing about the chart, and for many of us, also the most interesting thing about how we spend our time, is what we say we are doing when we are not at work or asleep. Taking out the 'responsible' stuff from the chart (taking care of others, household activities), and that still leaves something like 5 - 6 hours a day (remember, these are working days), of more or less 'free' time. No one I know will admit that they feel like they have that much free or leisure time each day.
I don't have any really prescient or even pithy conclusions to draw from this data except for just thinking about (and similar to what I blogged about earlier in the week), how I am spending my time and whether or not I am getting closer to the various goals I have.
What do you think? How does your day stack up against this data?
Have a great day.