Quantcast
Subscribe!


Enter your email address:

Delivered by FeedBurner


E-mail Steve
This form does not yet contain any fields.

    free counters

    Twitter Feed

    Entries in chart (85)

    Monday
    Feb032014

    CHART OF THE DAY: Where the new jobs are projected to be

    Once again from our friends at the Bureau of Labor Statistics, today's chart is all about jobs - more specifically a look at in which occupations the BLS is forecasting the greatest numerical growth in jobs for the ten-year period of measurement, 2012 - 2022.

    Take a look at the chart, then (of course) a few comments from me afterward:

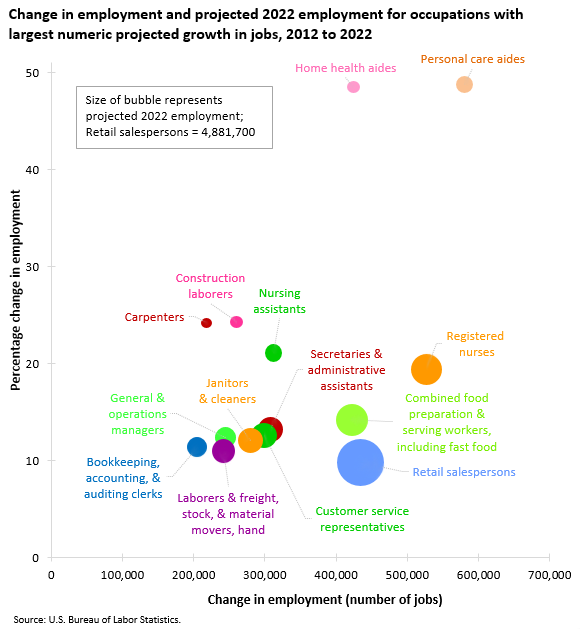
    Digging in to the data a little bit more (and taking into account the sheer difficultly in making these kind of far out into the future sorts of projections), reveals both some warnings, and some surprises.

    First off, something that is not surprising, is that of the 30 areas projected to experience the largest employment increases, 5 are in healthcare, including 3 of the top 4 jobs that are expected to see the greatest increase, (personal care aides, registered nurses, and home health aides).

    Combined, the top 5 healthcare related occupations are projected to add 1.6 million jobs over the 2012–2022 decade. 

    But while the growth in healthcare jobs is not surprising, given the pressures being put on the healthcare system due primarily to an aging population, what is surprising is what the BLS suggests about the educational attainment needed by workers desiring to actually work in these faster-growing occupations.

    From the BLS sumary:

    Two-thirds of the occupations projected to add the most new jobs typically require a high school diploma or less, while only five typically require a bachelor’s degree.

    Now that little observation is, to me at least, a little surprising, or perhaps just a little misaligned with everything that we typically see about the importance of higher education as it relates to a candidate's job prospects. But upon closer examination of the BLS job growth projections, perhaps we should not be that shocked at all. 

    The care aides kinds of jobs, the retail jobs, the food prep and serving jobs, the customer service reps, (all in the Top 10 list of 'growth' occupations), well none of these require (typically), much if any higher education and of course, also typically offer relatively lower wages than the kinds of jobs of the future we like to think about, (like coding apps, designing wearable computers, or working in high finance).

    Yep, according to the BLS anyway, job growth to 2022 is going to be mostly about low-skilled, low-wage, low prospects kinds of service jobs.

    Actually the easiest kinds of jobs for the robots to take.

    Happy Monday.

    Wednesday
    Jan152014

    CHART OF THE DAY: The Labor Force in 2022

    ...will be older, (relatively smaller), more non-white, and will certainly have more robot participation...

    First, here is the chart, courtesy of our friends at the Bureau of Labor Statistics:

    And below are the key findings from the aggregate data presented in the chart above, as well as in the details on gender, ethnicity, and sub-age group data (all found from the BLS in a piece titled "Labor force projections to 2022: the labor force participation rate continues to fall").

    The Bureau of Labor Statistics (BLS) projects that the next 10 years will bring about an aging labor force that is growing slowly, a declining overall labor force participation rate, and more diversity in the racial and ethnic composition of the labor force.

    The labor force participation rate increased in the 1970s, 1980s, and 1990s and reached an all-time high during the 1997–2000 period. The rate declined during and after the 2001 recession before stabilizing from 2004 to 2008. The labor force participation rate fell in 2009 and continued to fall after the 2007–2009 recession ended. As the baby-boom generation ages and begins to retire, BLS projects that the overall labor force participation rate will continue to decline to 2022.

    During the 2012–2022 period, the growth of the labor force is anticipated to be due entirely to population growth, as the overall labor force participation rate is expected to decrease from 63.7 percent in 2012 to 61.6 percent in 2022.

    There is lots more in the details from the BLS piece, but I think you get the gist. And if you have been following this trend for any amount of time, you are probably not really surprised by the data.

    What is surprising, at least to me, is that whenever a new monthly employment report is released by the DOL that the talking heads on the business news continue to lament the low (and declining) labor participation rates, and speculate on the reasons why and the potential policies that could reverse this trend.

    If these 2022 projections from the BLS are accurate, or even close, I wonder if it makes more sense to quit trying to bring back the days of 2000 or so, and instead focus on what a smaller, more diverse, and older labor force means to our organizations and our economy.

    No fiscal program is going to turn back the clock for all the aging boomers. And hardly any feasible rise in the minimum wage is going to convince more 16 - 24 year olds that they would be better off working more and going to school less.

    The only age groups where participation is increasing are 55+.

    Keep that in mind this year as you are working on your 5 - 10 year business plans.

    Happy Wednesday.

    Monday
    Dec162013

    CHART OF THE DAY: On the Labor Force Participation Rate

    Lately whenever we get a new jobs report that shows the official unemployment rate continuing on its slow but steady decline (currently at 7%), we also have to consider the Labor Force Participation Rate, that is, the percentage of the working-age population that is either employed or is actively looking for work, and thus considered to be officially unemployed.

    As seen in the below chart, the Labor Force Participation Rate has declined to levels not seen in about 35 years or so, to about 63%. 

    Or said differently, the percent of people that are classified as actually being in the labor force, (either working or actively seeking work), has sunk to a level not seen since the late 1970s.

    Every time these figures are reported and repeated, there seems to be quite a bit of speculation around the causes of this decline. Just why are there relatively fewer participants in the labor force?

    Is it simply a matter of demographics as retirements of the first wave of baby boomers (now in their mid-to-late 60s) start to accelerate?

    Or are younger workers simply dropping out of the labor force due to the frustration of not being able to find work, either due to a simple lack of openings or having repeatedly failed to secure work in what is still an extremely competitive job market?

    The underlying reasons for this drop in participation do matter I think, as they can be used to more effectively create policies and programs to address them, (if that is needed), as well as for HR and talent pros that might need to understand these trends and include them as an input into their workforce planning process.

    Shigeru Fujita from the Federal Reserve Bank of Philadelphia recently published a research paper on the topic, titled On the Causes of Declines in the Labor Force Participation Rate, that attempts to break down the causes of these declines, and for anyone interested in the topic is well worth a read.

    In a nutshell, the paper concludes that about 65% of the decline in the Labor Force Participation Rate since year 2000, (roughly when the decline began), and 2013 are due to retirements and disabilities, both suggestive of the 'demographics' side of the declining labor force equation. Note that the 'retirement' portion of the decline only commences in about 2010, when the oldest boomers would be about 65 years old.

    Additionally, the paper also concludes that while there was a significant jump between 2007 and 2011 of 'discouraged' workers leaving the labor force, i.e. people that wanted to work, but simple gave up trying to find work, that all the declines seen in participation since 2012 are due to increased retirements and not increases in discouraged workers. These conclusions suggest that the lower labor force participation rate is really the new normal, at least for the short term.

    I know I am probably boring you to tears at this point, but I find this data, and the reasons driving the changes, really interesting. If you're organization is having a hard time finding the people you need for your opportunities, or has plans to grow or expand in any substantial way in the near future, then these macro labor force trends are worth considering.

    Once folks leave the labor force, it is really hard to get them to come back, whether they have retired, or have simply given up.

    Have a great week!

    Friday
    Nov012013

    FOLLOW-UP: More on Home Ownership and Employment

    Yesterday, I posted about the downward trend in home ownership rates in the United States, coupled with the sharp rise in 'all-cash', primarily investment-driven home purchases, (which almost always are converted into rental properties), and the implications these trends might have on work, employment, and mobility.

    So it was really interesting to me that this morning more on the topic of the relationship between home ownership and employment was posted on Business Insider in an article called 'High Home Ownership Is Strongly Linked To High Unemployment [STUDY]", a look at some recent research out of Warwick University on this very subject. 

    The piece is relatively short, but I will pull out the most pertinent points below:

    High levels of home ownership are strongly linked to subsequent rises in unemployment because labor mobility becomes reduced, according to new research.

    Using data going back to 1950 across all U.S. states except Alaska and Hawaii, Warwick University economics professor Andrew Oswald finds that the lag from ownership levels to unemployment rates can take up to five years to show up.

    But he said the linkage, established using data on millions of randomly sampled Americans, was extraordinarily robust.

    Doubling home ownership in a state can lead to more than a doubling of the jobless rate.

    "I have become convinced that by boosting home ownership we have ruined our labor market," Oswald said.

    Oswald said the research may go some way to explaining why Spain, with a home ownership rate of 80 percent, has unemployment above 25 percent, whereas Switzerland, with a 30 percent ownership rate, has a jobless rate of just 3 percent. Germany, another nation of renters rather than home owners, also has relatively low unemployment.

    Home ownership unwittingly impairs the labor market by deterring people from moving in search of work, a process that is time-consuming and expensive; long commuting times might also discourage a householder from taking a particular job, his research suggests.

    A nation of renters, if indeed that is where America is moving towards, might not be all that bad for the future of work and employment, if this study has any truth and validity.

    And aren't we seeing and hearing from pretty much every front that surely one element of the nature and future of work is that it will be, for many more people that before, more fluid, more temporary, more 'project-based' and not 'employer-based'. 

    A future where many more people will bounce around from assignment to assignment, from 'employer' to employer, and from city to city even, as they chase the much more transient opportunities to ply their trade and earn a few bucks.

    Many of us have tales we like to tell about the 6 crappy apartments we lived in after college before we 'settled' somewhere and maybe bought a house, got married, or at least decided to live with a significant other, and maybe even had some kids.

    But that 'settling' process almost always came after the steady, 'permanent' jobs were landed. Maybe they were not the jobs or companies you saw yourself staying in forever, but they would be secure enough to save up some dough, prove to the mortgage company that you could in fact afford your new house, and even convince skeptical in-laws to be that you would be a suitable partner for their child. 

    But in a economic climate where 'permanent', (if there was really ever such a thing), work is fast-becoming a relic of the past, then too, it seems like some of the follow-ons that came from landing those jobs, (getting married, buying houses, having 2.2 children), are also naturally going to be impacted.

    If there are far fewer permanent jobs than it stands to reason that more and more workers will end up living like many of us did in our twenties - bouncing around from one place to another, living out of a few suitcases and boxes, only staying until the next job takes us somewhere else, since no 'job' is going to last too long.

    It is a great deal for the companies that want to engage with labor and talent in this manner, but I am not at all sure that as a society we are prepared for a much more transient, less-rooted, nomadic population of professionals, wandering from place to place, and rental house to rental house, chasing a dream that is receding further away all the time.

    But think about it, if we were all willing/able to move much more freely in pursuit of work and opportunity, how many of us would stay right where we are and how many would pick up and find something better?

    Happy Weekend all!

    Thursday
    Oct312013

    CHART OF THE DAY: The American Dream of Renting

    Ok, so perhaps that title was not totally fair, as the while the below chart could be interpreted in a couple of different ways, depending on your point of view and level of relative optimism/pessimism/cynicism.

    But first, the chart in question, showing the trends in American home ownership for roughly the last two decades, (my comments of course, after the jump):

    The current percentage of Americans owning their homes stands at about 65%, roughly equal to the rate in 1995, prior to the last two recorded recessions, (as indicated by the gray areas on the chart).

    And the rate has been declining since about 2004, well before the American financial crisis of 2008/9, the ensuing economic slowdown, and the dramatic tightening of the availability of mortgage credit.  Combine tighter credit standards with the sharp rise in unemployment (and employment security) in the period of 2008 - 2010, then you have the basic root causes for the fall in home ownership. Even the historically low mortgage interest rates of about 2011 until, well, until now, have not been able to reverse this trend. Oh, and one more data point to consider - all cash sales of property (primarily from banks and other investors), have continued to rise - some estimates say these cash sales now constitute half of all transactions. Even if a prospective individual home buyer has a stable job, and can qualify for a home mortgage, they often find themselves losing out to a competing all cash offer from an investor or syndicate.

    In the depths of the recession it was often theorized that employment mobility was becoming compromised by people's inability to sell (at a price that would be acceptable if they could sell at all), their existing homes in order to facilitate a job change or even a transfer inside their current company. In many parts of the country large numbers of homeowners were underwater on their homes, owing more to the mortgage holder than the home could expect to fetch in a sale.

    In 2013 and perhaps in the future, the trends in the rate of home ownership and in the increase of all cash and investor-driven residential home sales, while seemingly not positive developments for the average employee, could be ones that end up benefiting the organization. In 2009 and 2010, organizations were probably finding it hard, (or very expensive), to facilitate employee transfers around the country or to convince that desirable candidate to relocate from one state to another when selling a home at a loss simply was too much of a financial burden to take on, no matter how fantastic the job opportunity might have been.

    But with the home ownership trends heading downward, and the investor-driven all cash sales on the rise, the chances are increasing that the great candidate or that high-potential manager you'd like to send on a rotational assignment to Kentucky are going to much more able to make these kinds of moves in the future. Without the need to sell the house, well, most folks are just a few months away or a broken lease from taking the next great gig.

    Of course, while not being burdened by home ownership makes someone more likely to listen to your opportunity or offer, it also makes them equally able and receptive to everyone else's offers as well.

    Happy Halloween my friends.

    Page 1 ... 13 14 15 16 17