Quantcast
Subscribe!


Enter your email address:

Delivered by FeedBurner


E-mail Steve
This form does not yet contain any fields.

    free counters

    Twitter Feed

    Entries in economics (21)

    Monday
    Mar062017

    CHART OF THE DAY: The World Economy in One Chart

    You may have seen this chart passed around a week or two ago when it was published on Visual Capitalist, but as I was digging through my 'Read Later' pile over the weekend I felt like it was too good and interesting not to share.

    So without further delay,  visual look at the global economy, represented by country contribution to global GDP, and then as you DEMAND, some free comments from me after the data.

    (Email and RSS subscribers may need to click through to see the chart, and clicking on the chart will bring you to a much larger version)


    Courtesy of: Visual Capitalist


    Really interesting and cool chart, right? Three quick observations from me about what 'normals' like us should be thinking about when looking at the data.

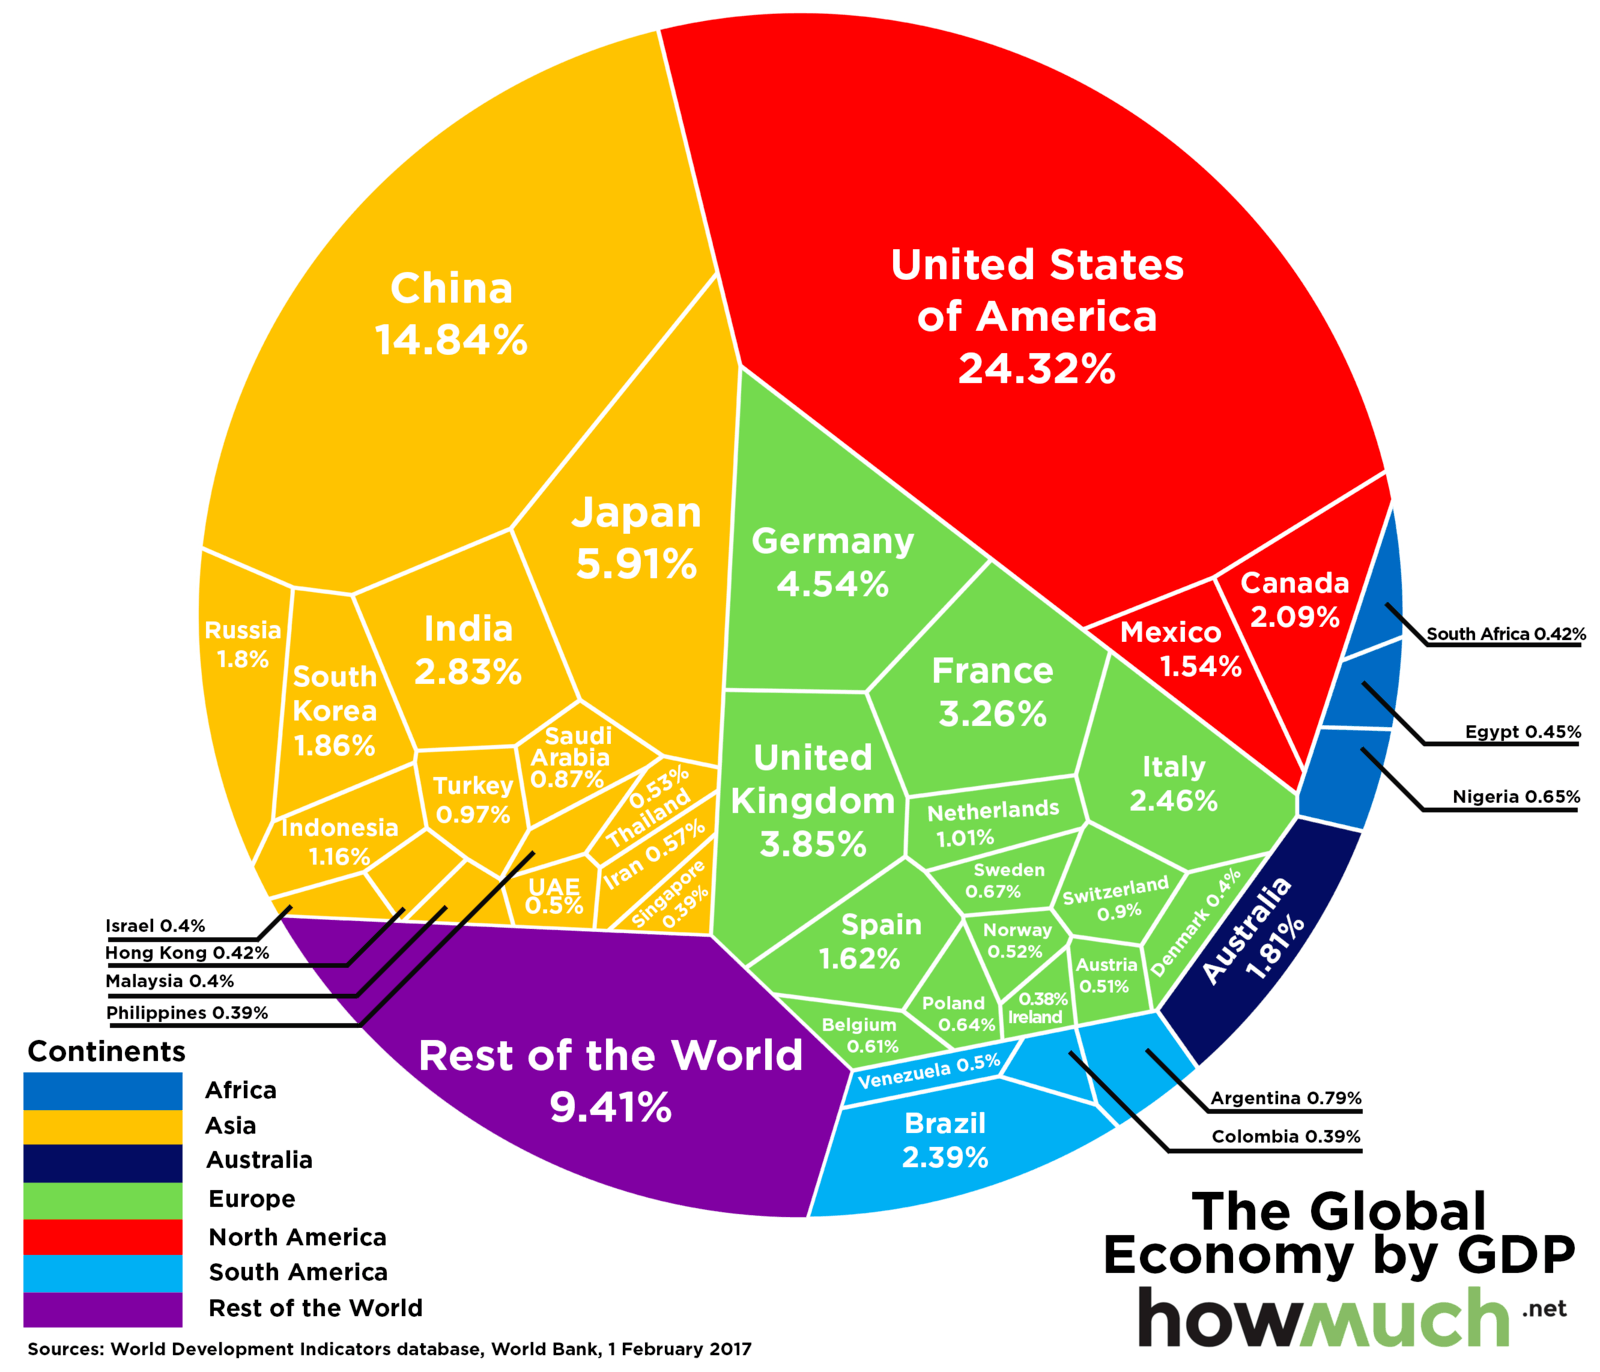
    1. Go USA! Ok, not trying to be too much of a cheerleader here. But while many other economies (namely China, but I will get to that in a second), have emerged on the world stage in the last twenty or thirty years, the USA still accounts for a shade under a quarter of World GDP. This is important for organizations, particularly US-based or centric organizations to remember even as they make their plans for international expansion. It probably would be a mistake to concentrate too much time and energy on markets that either are relatively small, (say the Netherlands or Spain), or not expected to grow as rapidly in the next ten years, (Germany or the UK).

    2. Don't sleep on China, (and to a lesser extent Japan and India). I know that it can be hard for many US businesses to wrap their minds around places like China and Japan. It is hard to to business there. The language and cultural barriers are more significant than say in Western Europe. It may take longer to establish a presence there. But make no mistake, future growth is being defined by what is happening in Asia - not in Western Europe. It may take a little more time, but the organizations that can make the investments, get in front of their competition, will be better equipped to capitalize in the parts of the world that are growing the fastest. 

    3. Perspective is really the biggest takeaway from a chart like this I think. We can, here in the US, get really full of ourselves,(see above), and it is a good reminder that even as the largest economy, more than 75% of economic activity is happening elsewhere. Insert your own country in the above sentence and the percentages get even more sharp. Places that we think of as economic leaders like Germany and the UK contribute less than 5% each to global GDP, while seemingly set up for being surpassed soon by places like India and South Korea. None of us are all that big a deal.

    Anyway, that's it from me for a busy Monday - have a great week!

    Monday
    Feb062017

    Want a larger piece of the (economic) pie? Look for the most competitive industries

    Caught a really interesting piece over the weekend at The Atlantic looking at one potential reason why (relatively speaking) that worker's or labor's share of GDP is decreasing when compared to 'capital's', i.e. ownership's share. This divergence in share has been thoroughly examined as a primary driver of increasing economic inequality, and was the main subject of Thomas Piketty's influential Capital in the Twenty First Century from 2014.

    Said differently, and much more simply, today in the aggregate is getting a smaller piece of the overall economic pie than in the past. There are tons of data points you can examine on this, but they all more or less show the same thing - on average, workers are no better off today, and might be worse off, than they were 20 or 30 years ago.

    Why The Atlantic piece titled One Reason Workers are Struggling Even When Companies are Doing Well caught my attention is that it shared some insights from a recent NBER research paper on not just that this share divergence is happening, but offered some reasons as to why it is happening.

    And the theory is kind of an interesting one, and if true, can help better inform anyone making career/industry decisions moving forward. Best of all, it is a pretty simple idea that boils down to this - The more concentrated an industry is, (fewer competitors and the ones that dominate are all pretty large), the lower labor's share of the income for that industry will be.

    Here's some color from The Atlantic piece:

    The researchers looked at data from the U.S. Economic Census between 1982 and 2012 for nearly 700 industries in six major sectors, including manufacturing, retail, wholesale, services, finance, and utilities and transportation. Looking at how much the four largest firms in each industry accounted for in terms of total sales in the industry, they found an upward trend in concentration in all of the six sectors, meaning that it was increasingly common that just a few firms accounted for the bulk of sales. Since the U.S. Economic Census reports payroll, input, and employment, the researchers were able to observe a negative correlation between concentration and labor’s share—meaning that this trend of so-called superstar firms tends to mean workers taking home a smaller share of the pie. Moreover, the more concentrated an industry had become, the larger the decline in labor’s share.

    Unpack that a little bit to show a pretty straightforward formula:

    Industries have tended to consolidate over time --> the more dominant the four largest firms in an industry become --> then decreasing shares of the overall industry profits find their way to workers/labor.

    There are a couple of reasons on offer for why more consolidated, big-firm dominated industries are getting worse in terms of share of profits for workers. One is that these companies are simply growing revenues at a faster pace, and labor costs just have not (or do not need to) keep pace. Another is that modern, transparent business practices make it easier for consumers to find and reward the 'best' companies, which drives out competition in the industry faster than before - and reduces the potential number of firms competing for workers.

    The takeaways for the average employee?

    Probably that it might pay, (no pun intended), to keep on eye on the relative levels of competition in your industry, particularly if you are in a role that feels industry-specific. If your industry has seen consolidation with weaker competitors being driven out of business (or being acquired), the trends suggest a shrinking percentage of profits will find their way to you and your colleagues.  

    You might be better off thinking about an industry that seems to have more, and more even competition, where the market share, (and to some extent the demand for labor), is not being controlled by two or three big companies. And one where the threat of competition for your skills can either score you a better offer somewhere else, or give you more leverage and power in your next compensation negotiation with your current shop.

    More options might not be better for the owners of your company, but they might be much, much better for you.

    Have a great week!

    Monday
    Jun012015

    When liberal hipsters turn out to be ruthless capitalists too

    It seems to be a pretty widespread and more or less accepted assumption that the next generation of folks entering the workplace are more concerned with an organization's reputation for responsibility, for doing 'good', and for acting as a good community citizen than were prior generations. Where the boomers and Gen X were much more pragmatic (and possibly cynical), the Gen Y and Gen Z and the whatever comes next cohorts are going to evaluate organization's commitments and actions in the community and towards their customers and employees much more closely and critically when they make their decisions about where to work and (probably more importantly), where to spend. Like another nemesis of mine, 'Culture eats strategy for breakfast', (don't get me started...), this notion has been reported on and repeated so many times that I think it is worth considering if, you know, it actually isn't true, or at least isn't completely accurate.

    I started thinking about this when reading about of a new play titled World Factory being staged in London at the Young Vic theater. In the play, audience members participate in what is essentially a global business strategy game, placed into teams who have the job of navigating a fictional global clothing manufacturer through a complex set of scenarios and decisions. It is basically like the kind of gamified scenario exercise you'd see in any college business strategy class. But what has been happening at World Factory is kind of interesting.

    From a recent review of World Factory in the Guardian:

    The audience becomes the cast. Sixteen teams sit around factory desks playing out a carefully constructed game that requires you to run a clothing factory in China. How to deal with a troublemaker? How to dupe the buyers from ethical retail brands? What to do about the ever-present problem of clients that do not pay? Because the choices are binary they are rarely palatable.

    The classic problem presented by the game is one all managers face: short-term issues, usually involving cashflow, versus the long-term challenge of nurturing your workforce and your client base. Despite the fact that a public-address system was blaring out, in English and Chinese, that “your workforce is your vital asset” our assembled young professionals repeatedly had to be cajoled not to treat them like dirt.

    And because the theatre captures data on every choice by every team, for every performance, I know we were not alone. The aggregated flowchart reveals that every audience, on every night, veers towards money and away from ethics. But what shocked me – and has surprised the theatre – is the capacity of perfectly decent, liberal hipsters on London’s south bank to become ruthless capitalists when seated at the boardroom table.

    Fascinating, and possibly kind of revealing as well. It is certainly much, much easier to say that corporate ethics and community responsibility is important in making employment and consumer decisions. But, even in a fictional exercise like World Factory, it is often, (maybe always), much harder to live and take decisions that are 'responsible' when facing incredibly tough business, environmental, and social challenges. 

    Business if often messy. Capitalist systems often force tradeoffs to be made, ones that at least according to what we think we know about Gen Y and Gen Z are not in line with those generations world views. But once Gen Y and Gen Z are actually in charge? World Factory is just one small exercise, but what if it hints at what Boomers have known for a while - every generation follows pretty much the same trajectory as they mature, take on more responsibilities, and get more experience in how the world works.

    And then in about 10 or 15 years we will have moved on to a new set of young people who will be lamenting the materialistic robber barons formerly known as Gen Z.

    Have a great week!

    Tuesday
    Dec092014

    ECON 101: On high, low, and middle-skilled workers

    There is a great analysis on how workers holding jobs in different skill levels, (high, middle, and low) over at the Federal Reserve of Atlanta site that if you are as much of a labor market/macro workforce data geek as I am, I highly recommend reading.

    The question the researchers set out to answer was based in this: We know that from a combination of the most recent economic recession and augmented by persistently advancing automation technology, that so-called 'middle' skilled workers were the most hard-hit group in the last downturn and recovery. What the researchers wanted to understand is what has or is happening to these displaced middle skill workers. Were they still out of work? Were they forced into lower skilled or service-type jobs? Or did they get the opportunity to move into more highly-skilled (and better paying) jobs?

    Note - for the purposes of this analysis, 'middle-skilled' cconsists of office and administrative occupations; sales jobs; operators, fabricators, and laborers; and production, craft, and repair personnel (many of whom work in the manufacturing industry).

    So let's take a look at the data - first the aggregate employment levels since 1998 for each skill category:

    As of September 2014, the middle-skill employment level was still about 9 percent below the (pre-recession) 2007 level. In contrast, employment in low-skill occupations is 7 percent above pre-recession levels, and employment in high-skill occupations is about 8 percent higher than before the recession took hold. So the first assumption, that middle-skilled workers were hit harder by the recession/recovery than workers in the low and high skilled groups seems to have held up.

    But what has been happening to these displaced middle-skilled workers? Surprisingly, many of them are/have moved into the high-skilled classification. About 83% of the displaced middle-skilled workers that are back employed are still in middle-skilled roles. But what about the other 17% of workers?

    Let's take a look at the data:

    The data shows that about 13% of the group has transitioned from a middle-skilled job into a high-skilled one. Only about 3.5% have been driven into a low-skilled role. This may seem like a small percentage of upward mobility, but it still seems significant to note.

    If, as many economists expect, there continues to be further pressure and erosion of middle-skilled workers (which if you take another look at the first chart you will see still make up the largest category), it is important to the overall economy what happens to displaced middle-skilled workers. If they can transition into high-skilled roles, they see on average a 27% increase in compensation, as opposed to a 24% drop if they move into low-skilled roles.

    While this data and these figures seem all kind of abstract and distant, then think about them this way: Think about your life and lifestyle with a 27% raise in compensation. Then think about it with a 24% pay cut. Pretty big difference, right?

    And then take those scenarios, multiply them by 10 million or so, and now you have some feel for how important this issue is for the US economy.

    Wednesday
    Apr092014

    CHARTS OF THE DAY: On Increasing Job Openings and Scarce Candidates

    Today's chart(s) of the day come courtesy of Gluskin Sheff + Associates, and the excellent (and filled with charts) report from David Rosenberg titled 'The US Labor Market in Pictures, Tighter Than It Looks!', which provides a fantastic overview and re-set of the macro trends for employment in America.

    Taken from the Gluskin Sheff report, I want to call out two of the report's dozens of charts, the first on the growth in absolute job openings in the USA:

    Job openings continue to rise from the post-recession bottom, and with about 4 million current openings, seem on track to eventually climb to eclipse the pre-recession highs. In fact, if suddenly all 4 million openings were filled from currently (officially) unemployed workers, the unemployment rate would fall to about 4%.

    But of course things are not so simple or neat, and this next chart illustrates the challenges that many employers are reporting trying to fill jobs in a time of rising openings:

    Companies, especially smaller companies, are reporting increases in 'difficult to fill' positions, (a level just off it's five-year highs), and if you dig into the Gluskin Sheff report further, you will see that over 40% of companies are reporting 'few or no qualified applicants' for their openings.

    These trends of rising job openings combined with, at least for many types of jobs in many industries, are having a tightening effect on the labor market overall. I am not smart enough to try and tell you exactly why this is happening right now, it is certainly a complex and debatable set of circumstances that includes the aging workforce, the governmental safety net, firm's inability or unwillingness to invest in training candidates, and the 'fake-or-maybe-it-is-not-fake' shortage of candidates with the needed skills for the modern age.

    But the data seem to show one thing that is clear - the labor market is starting to show signs of tightening, probably making it more difficult for you in the short and medium term to deliver the candidates you need to sustain your business and talent objectives.

    It might be time to start re-thinking all the things that make your shop the place where increasingly scarce candidates want to land.

    Happy Wednesday.