Quantcast
Subscribe!


Enter your email address:

Delivered by FeedBurner


E-mail Steve
This form does not yet contain any fields.

    free counters

    Twitter Feed

    Entries in demographics (14)

    Monday
    Mar192018

    What the Toys R Us meltdown reminds us about workforce trends

    By now you probably have seen the sad news that Toys R Us is in bankruptcy, and is facing the likely closure of its 700+ stores in the US in the coming months.

    Definitely a sad day for many, especially for the thousands of Toys R Us employees soon to be out of work, and for the let's say 'traditionalists' among us who still enjoyed shopping for toys and games and the like in the 'real world', and not just from an Amazon app.

    Of the many reasons that have been blamed for Toys R Us demise, competition from Amazon (and others) is frequently cited, along with the pretty staggering amounts of corporate debt and debt service payments that Toys R Us has been burdened with since its acquisition by Private Equity companies in 2005. Other post-bankruptcy analyses have pointed to Toys R Us failure to modernize its shopping experiences, inability to grasp digital commerce trends, and the fact that they lost touch with their most important customer - mothers shopping for their kids.

    But there is one other factor that has contributed to the toy retailer's plight, one that has not been mentioned as much in the coverage, and one that has much wider implications in work and workplaces as well. And it is this: people in the US are having fewer children, thus creating fewer of Toys R Us' prime 'end customers', and, eventually, fewer entry-level workers for all US firms to recruit.

    Here it the thing, the folks running Toys R Us maybe couldn't figure out what to do about this trend, but they did see it coming. Here is an excerpt from their most recent 10-K financial filing from April 2017:

    "Most of our end-customers are newborns and children and, as a result, our revenues are dependent on the birth rates in countries where we operate," the filing reads. "In recent years, many countries' birth rates have dropped or stagnated as their population ages, and education and income levels increase. A continued and significant decline in the number of newborns and children in these countries could have a material adverse effect on our operating results."

    Data from the CDC in the US backs that up - the most recent data available from 2016shows the US birth rate hitting a record low, and with no obvious sign of this trend changing, retailers like Toys R Us are going to face continuing pressure. Longer term, if this trend does continue, all kinds of employers will face pressure too - a different kind of pressure perhaps, this one stemming from relatively fewer entry-level or younger candidates, as well as the need to create workplaces that are more open, accommodating, and available to older workers too.

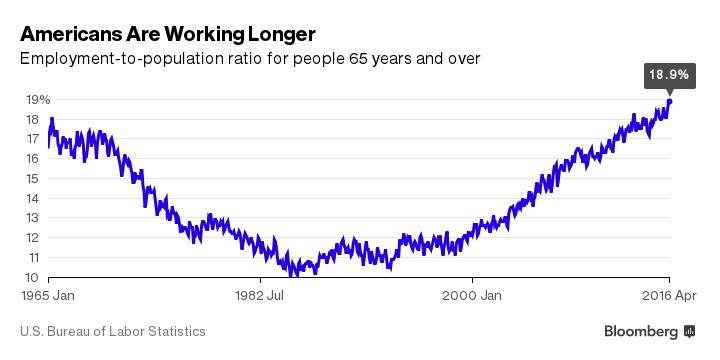
    Since I love charts, I will close with this one, from our pals at FRED - a look at the increase in the 65+ labor force in the US over the last 20 years or so.

    I will spare you trying to squint at the small print, but the total number of workers aged 65+ has more than doubled since 2000 - with almost 10M people in that group as of the latest data. And even if you can't read the small print, it is easy to see the 'up and to the right' trend in the data.

    Fewer babies and young kids means trouble for Toys R Us in 2018. It could mean recruiting problems for your organization too, in a few years. Don't wait until it is too late, like our pals at Toys R Us, to know how to react.

    Have a great week!

    Tuesday
    Nov282017

    CHART OF THE DAY: We're all getting pretty old

    A recurring topic on these Chart of the Day posts for some time now has been the impacts and effects on work and workplaces of an aging population. While in the US the demographic 'time bomb' is not expected to be as extreme as it will be in a place like Japan, there still will be some impact, mainly due to the large Baby Boomer generation exiting the workforce en masse.

    Population pyramids are a cool way to visualize the demographic mix in a place and at a point in time, and the below GIF courtesy of Visual Capitalist presents a moving image of the past and expected US population by age from 1980 - 2050. Have a look (or two or three) at the chart, and then some FREE comments and observations after the data.

    Pretty neat, right?

    A couple of things stand out from the data. In 1975, the median age in the United States was just 28 years old. However, it’s been rising fast as the Baby Boomers age, and it’s expected to break the 40 year mark by 2030. And just watch in the chart how life expectancy and average age both keep creeping up. Feels like that is a good thing but even still, these trends have some important implications for workplaces, governmental policies, and society overall.

    An older population by default means more older workers. Whether it is by need or choice or even employer choice, more and more older workers will be a feature or more and more workplaces. And what older workers, say ones in their later 50s and up will want, need, and expect from work and from employers is by definition much different from what the newest group of college graduate recruits will be looking for.

    And while that has probably always been the case, the numbers and increasing age of an organization's oldest workers make that problem or challenge a little tougher than in the past. The mix of ages of the workforce is skewing older, and that has implications for all areas of HR - from training, to benefits, to workforce management and more. And not to mention the need for organizations to be really aware and cognizant of more younger managers, many who lack adequate training and experience in management, wo will be asked to lead and coach more of their older colleagues.

    I remain endlessly interested and fascintated by how these macro demographic trends will impact work and workplaces. And this one in particular, as sadly, I, like you, am getting older every day.

    Wednesday
    Apr122017

    It's better to have a job when you're looking for a job

    As the 2007-2008 financial crisis and subsequent economic recession fade further and further into the distance, we don't in 2017 talk about unemployment all that much. The sustained recovery in the labor market has pushed unemployment to near "full employment" levels of about 4.5% in the US, and in many sectors and job roles most employers would report 'good help is hard to find'. Until the robots take over. But that is a different story for another time.

    Back to unemployment though. In 2008 and 2009, there was plenty of discussion about the best ways to help the many, many folks who were out of work to get back into the labor force. Lots of job search gurus appeared online, plenty of networking and support groups were created, and certainly significant governmental support, (cars, banking, insurance), was marshalled to try and stop the bleeding in the labor markets and help get people back to work (or keep them in work).

    Around that time, as the unemployment rate topped at about 10%, one peculiar storyline emerged, and pretty consistently as well - namely that folks who were unemployed, and 'actively' looking for work, were often characterized as less desirable candidates than say someone who was currently employed, and may not even be actively looking for something new. The dream 'passive' candidate if you prefer that term. Lots of anecdotes about hiring managers passing on any candidate who was out of work were shared, and plenty of folks, (I possibly was one of them), opined about how unfair that this kind of (for lack of a better word) discrimination against the unemployed was seemingly more and more prevalent. And anecdotal or not, it certainly seemed that looking for a job when you did not have a job was much, much tougher than looking for one when you were already employed.

    But just how much tougher is it, really?

    A recent study by the Federal Reserve Bank of New York looks to put at least some data around these anecdotes by looking at job search activity by unemployed workers, by employed workers, (both passive and active), and people out of the workforce. The entire report is interesting and worth a read but I thought I would tease out two of the report's most interesting findings about job search, and more importantly, job search outcomes.

    1 - Lots of employed people are actively looking for work - almost one quarter of them 'actively' searched in the trailing four weeks of the survey period

    Not shocking I guess, but also the 23.3% doesn't account for the probably much larger number of employed workers that would be open to at least discussing new opportunities, even if they were not in active search. Said differently, one of the reasons contributing to a bias in favor of employed workers is the fact that just about all employed workers are still in the candidate pool anyway. At least partially in.

    So how does this perceived bias influence outcomes? Here's the money chart from the study, depicting how search behavior and application intensity translate into positive outcomes, i.e. job offers.

    I will help you with the fine print here. Unemployed workers make up about 7 percent of the survey sample. They send out 40 percent of the total job applications, but receive only about 16 percent of the total job offers.

    In contrast, folks who were employed and were actively looking for work make up about 20 percent of the sample but receive almost half of all offers. Further, the employed not looking for work (and who do not apply for any jobs), receive about one‑fourth of all the offers in our sample—more than the unemployed who are the most active searchers and applicants.

    So how much better is it to be employed when looking, (or in many cases not looking) for a new role?

    Well, according to this data, much, much better. Roughly it takes eight times the effort in terms of time spent and four times the application rate for unemployed folks to generate a similar rate of job offers that employed workers realize - many of whom are not looking for work at all.

    Hopefully we won't have another dramatic economic or market shifting incident like the financial crisis that drives up unemployment and will make these findings and their impacts top of mind again. But it is good food for thought for any of us who may not love the job we have now, and are looking for something better.

    We just might want to hold on to that crappy job as long as we can, because having it makes our odds of finding the next (hopefully less crappy) job that much better.

    Friday
    Jul292016

    CHART OF THE DAY: Big Trends in Working Age Population

    Super quick hit for a summer let's-get-out-of-here-and-head-to-the-beach Friday where, at least here in the USA, many of us are going to tire of the phrase 'Corn Sweat' (go ahead and Google it).

    Today's chart comes from our pals at the Economist, from a piece titled 'Vanishing Workers'. First the data, then some quick observations from me before you can power down and crack out the sunscreen.

    In a nutshell, this data suggest the working age populations, (15 - 64),  in China, Japan, and Europe are all set to fall (relative to a 2015 baseline), somewhat dramatically in the next few decades, while by the same measure, this group will continue to rise in the US, (albeit at a slower rate than the recent past).

    What happens (in general), when there are relatively fewer available workers, and what might be the implications in the USA where we will be bucking against this trend?

    1. Fewer workers generally lead to rising wages, at least in the near term. And there is plenty of evidence of this already happening in China, where increased competition for workers (especially in manufacturing), has driven up wages for these workers, and made many firms think again and re-evaluate the cost advantages of locating these kind of operations in China.

    2. Falling working age populations impact industries in different ways. With fewer workers, (and an increase in the dependency ratio, the total number of children and elderly divided by the working age population), housing and construction tends to suffer, as there is less demand for new, and larger housing from workers overall. But health care, child care, and related service industries might fare better, with an increased burden of care demanded by larger proportions of kids and older people.

    3. For the US, one of the few industrialized economies that will not see such a fall in working age population over the coming years, the news is pretty positive. Larger proportions of working age folks tend to have a pretty direct and beneficial impact on GDP, output, and overall quality of life. And of course more folks in their prime earning years reduces the overall drag on the economy that can result from a higher dependency ration, all things being equal. There should be less need to raise payroll and corporate tax rates for example, in order to continue to fund things like Medicare and Social Security. The downside risk of course, is that jobs and opportunities for workers have to rise commensurately with this demographic trends, or else you end up with higher than desirable levels of unemployment or under-employment. But balanced against the alternative, potentially not having enough prime age workers to meet demand, (which will send investment elsewhere), it seems the US position to be the more desirable one in the long term. And for my line of work, the HR Tech space, it seems clear that growth and opportunity for HR Tech companies will continue to primarily reside in the USA, as Europe and other countries working age cohorts, (the 'users' of HR Tech), continue to fall.

    Love the data. Love labor market demographics. If that makes me some kind of a geek, so be it.

    Me fretting over me Level in Pokemon GO also makes me a geek, but for a different reason.

    Monday
    May162016

    CHART OF THE DAY: More Americans are Working Longer

    I am a total mark for labor force data and today's Chart of the Day fits the bill perfectly. Check out the below chart on the Employment to Population ratio for Americans aged 65 and up over the last 50 years, and of course some FREE comments from me after the data

    (Chart courtesy of Bloomberg)

    Lots of interesting points we can tease out of this data, so let's go..

    1. Just under 19% of Americans age 65+ are currently in the workforce, according to the BLS. This is the highest percentage of working people in this age cohort since the early 1960s. 

    2. Why are folks in this age cohort working in greater numbers than before? The most commonly cited reason according to a recent study from Transamerica is that they need the income and benefits. The financial crisis, and the tech bubble that busted a few years before that, devastated many baby boomers' retirement savings accounts, and has forced them to work longer than they had originally planned.

    3. The next most commonly cited reason for 65+ folks to remain in the workforce is that, well, they like their jobs and want to remain a part of their organizations. You probably know, or maybe feel this way yourself, that traditional 'retirement' is not at all that appealing. From the same Transamerica survey, 36% of respondents indicated enjoying their work and wanting to stay involved in the workforce was a primary reason to delay or postpone traditional retirement.

    4. Finally, a couple of other trends are factoring in to help drive the employment ratio up for older workers. Some organizations need the experience and expertise of these workers, and would have a difficult time replacing them should they begin to retire in greater numbers. In certain, less exciting industries, these older workers remain essential to the organization, and are being incented to stay in the labor force. And one more thing - folks are just living longer and remaining more productive later in their careers than in the past.

    Add it all up and it seems that these trends suggest that more and more of the workforce will be comprised of older, 65+ workers. Business and HR leaders that want to take best advantage of this situation will make sure they are not ignoring older workers in their recruiting, are willing and able to make necessary adjustments and accommodations as needed, and are actively engaging their older workers in important projects and in mentoring their younger, less experienced workers.

    We are all getting older. It just seems like it is happening all at once.

    Have a great week!