Quantcast
Subscribe!


Enter your email address:

Delivered by FeedBurner


E-mail Steve
This form does not yet contain any fields.

    free counters

    Twitter Feed

    Entries in chart (85)

    Wednesday
    Jun062018

    CHART OF THE DAY: Job Openings Continue to Increase to New Record Highs

    I know I've covered this territory a hundred times, it seems like every month lately, but I feel compelled once again to share the headline number from the monthly Bureau of Labor Statistics  JOLTS (Job Openings and Labor Turnover Survey) Report released earlier today.

    Here's the headline (and an accompanying chart from our pals at the St. Louis FED) - Total Job Openings have climbed to 6.7 Million - reaching another new record high in the history of the data series.

    The steady increase in record high job openings has been one of the truly amazing developments in the aftermath of the financial crisis and recession, which saw openings bottom out at about 2.2M in July 2009.

    The questions are now twofold I think. One, just how high is the ceiling for US job openings to climb towards? I mean these records continue to be set even while trade wars are constantly in the news and many financial and labor markets observers have no idea what strange 'news' emanating from Washington might do to the market and the economy?

    And two, when and by how much do we begin to see a much more pronounced increase in wage growth, as companies are finally forced to increase wages in order to try and fill these millions of openings? The sluggish nature of wage growth in the face of seemingly and endless supply of open jobs has been one of the must puzzling aspects of the labor market in the last several years. Something has to give soon, right?

    It's a good time to be looking for work, I would say.

    Have a great day!

    Tuesday
    May082018

    CHART OF THE DAY: Your semi-regular labor market update

    Two quick charts on my favorite CHART OF THE DAY topic - the trends in macro labor force dynamics in the United States.

    First, the big headline from a few days ago, the official unemployment rate in the US dipped below 4% for the first time since late 2000, ( was the ) hitting 3.9% as of the end of April 2018.

    For a look at this headline trend, see the below chart from our pals at FRED:

    And while this dip below 4% for the first time in almost 20 years was what most reports about the state of the labor market honed in on, (and probably rightly so), the 'truth' of the health of the labor market usually resided in other metrics. Like, for example, one of my favorites - the length of time it takes organizations to fill an average open position.

    Here's the latest on that - from the DHI-DFH "Mean Vacancy Duration" data (the latest I could find on this is from the end of February 2018).

    While you can see some upticks and downticks in the average time to fill, the trend since the end of the recession in 2009 is clearly up and to the right - meaning it continues to take longer and longer for most companies to fill open jobs. Officially, the mean vacancy duration for February 2018 is at 28.9 working days - essentially over a month to fill any open job.

    If you did into the details of the report, (and I did, since I am a weenie), one number really stood out. It now takes over 21 working days to fill roles in the hospitality and retail sector - think hotels, restaurants, fast-food, retail stores. That number is up dramatically from its 'bottom' of about 14 days just a few years ago. You would think that these roles should be the easiest to fill, and maybe they still are, but even today's easy roles to fill are taking longer and longer to actually be filled.

    There is more to this story, and I need to take some time to look at what is happening with wage data, labor force participation, and the openings and quits rates, but these two charts and their data are both pretty revealing.

    It's probably a good time to be a job seeker, all things being equal.

    And it is also a good time to be a recruiter - a good one anyway, because your value to organizations keeps growing.

    That's it from me - have a great day!

    Friday
    Apr202018

    CHART OF THE DAY: Mount Stupid

    Really quick shot for the end of a busy week, where despite it being nearly May, it is still snowing as I write this.

    Today's CHART OF THE DAY does not cover one of the normal themes I usually like to hit with these posts - employment, the labor force, the aging population, how terrible the Knicks have been, etc.

    No, today's chart, courtesy of SMBC Comics, is meant to elicit a chuckle and perhaps make you think, even just a little, before you feel the urge to chime in on a topic, issue, person, or event that you really don't have all that much information about.

    Here's the chart, the one last comment from me after that:

    Knowing just about nothing about a subject generally doesn't get you into trouble. Neither does being incredibly well-versed. In the former case, we usually have enough sense to keep out of the conversation and debate. And in the latter case, even if we run into a disagreement, we can usually have facts, data, or even just plain old experience to back up our opinions.

    But when we know just about enough to simultaneously not seem like a complete fool but not enough to avoid becoming that fool?

    That my friends is 'Mount Stupid.'

    And you don't ever want to be up there. Besides being unpleasant, it's way, way too crowded.

    Have a great weekend!

    Monday
    Apr022018

    CHART OF THE DAY: On the future of employer based health care benefits

    Is it Spring Break where you live?

    It is where I live - so I am going to be trying to balance some Spring Breaky things along with the blog, work, the HR Happy Hour Show and some other things.

    So if you are trying to reach me on something this week please be patient more patient than normal.

    But on to today's topic and Chart of the Day - and with a special bonus chart.

    A few weeks ago on the HR Happy Hour Show I was joined by benefits expert Shan Fowler to talk about the Employer Health Care Benefits Update for 2018.On the show, we discussed changes (or potential changes) to the Affordable Care Act, how some employers may shift the health care burden back to employees, and what the future of employer-based health care benefits might look like. In that same vein, I wanted to present two charts today - one directly related to this topic of the future of employer health care benefits, and a second chart that may help to give some depth and context towards understanding the first chart.

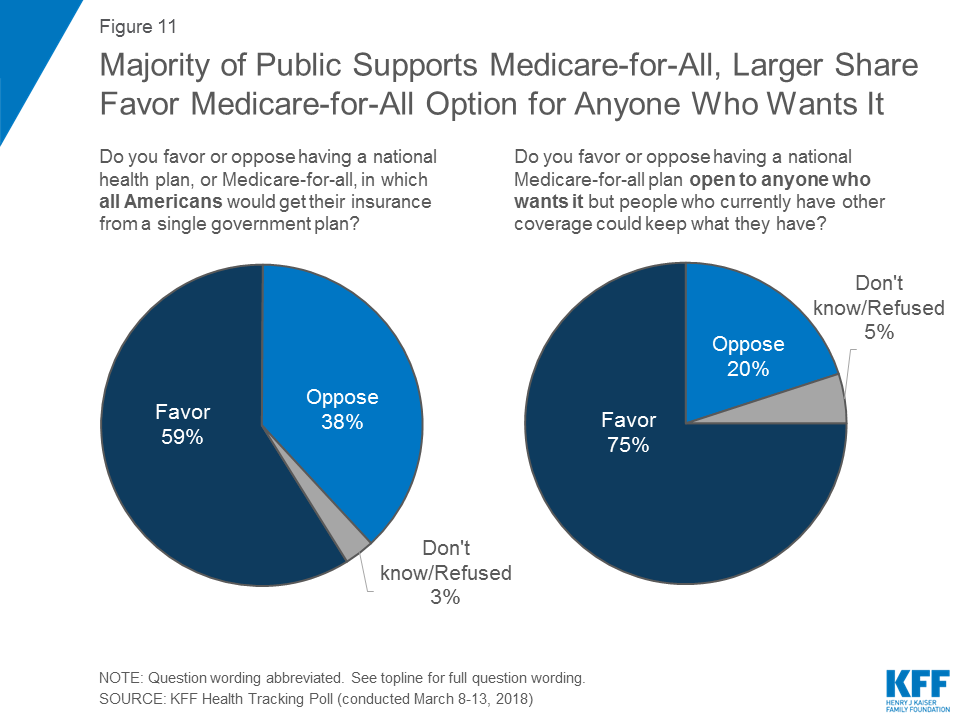
    Chart 1 - Courtesy of the Kaiser Famlly Foundatain's March Health Tracking Poll, which asked a representative sample of over 1,200 US adults whether or not they were in favor of a 'national health plan, or a Medicare for all plan', and also if they favored such a plan that was 'opt-in' only?

    Here are the results which showed 59% of Americans in favor of a national health plan, and 75% in favor of such a plan with an 'opt-in' provision.


    Let's go to Chart 2 before offering up some comments and observations about what the data might mean.

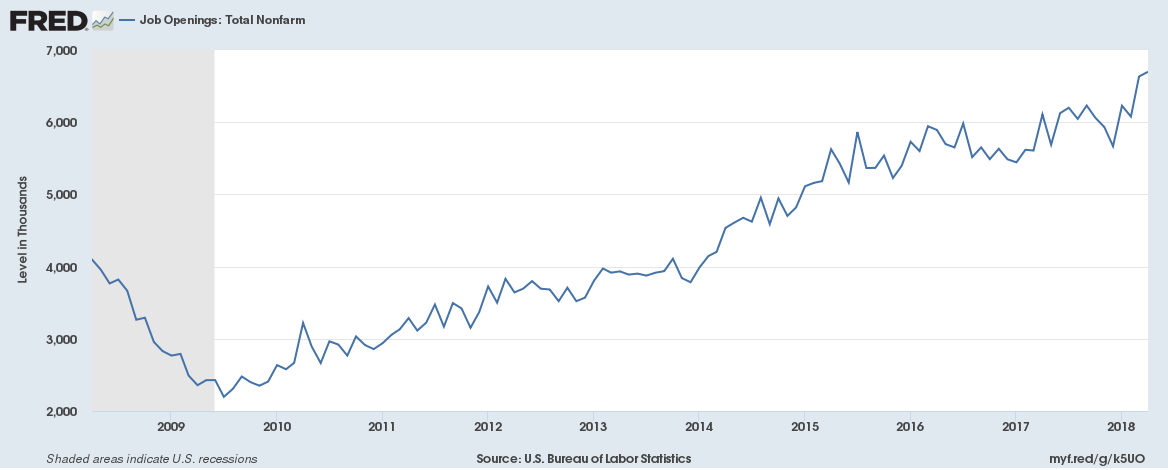
    Chart 2- From the Brookings Institute, 'Rethinking worker benefits for an economy in flux', a look at the growth (and comparative growth) of non-employer firms, basically independent workers in the 'gig' economy.

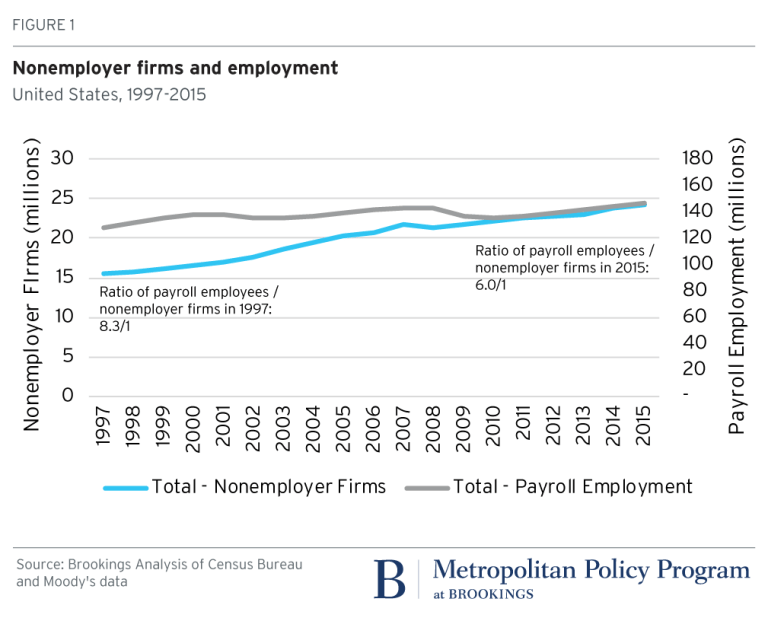
     For nearly two decades, the growth of nonemployer firms - firms that have no employees and mostly constitute incorporated self-employed freelancers (workers in the “gig economy”), has consistently outpaced traditional payroll growth. More and more workers in the 'gig' economy generally translates to more and more workers who lack access to 'tradtional' employment benefits - health care, paid time off, retirement and 401(k) plans, etc.

    And it's this trend in workplaces, and truly, in the nature of work and jobs themselves, that probably is driving the increases in interest and/or support for some kind of nationalized, and more importantly portable, set of health care benefits. Increased workplace fluidity, less growth in traditional payroll employment compared to gig work, and additional pressures on workers to provide child and elder care are all conspiring to make the idea of national/portable health care coverage more appealing to Americans.

    Politics (and passions) on both sides of the spectrum will likely make the passage of any kind of nationalized or Medicare for all plan really unlikely in the near term. But that is not the only mechanism to create platforms for more portable health care - programs that would be more easily accessible to the growing number of workers who lack access to traditional employer-based plans.

    A number of states, (most notably Washington) are proposing programs that would create non-profit benefit providers, to which employers of 1099 workers would contribute, and who would then collaborate with workers to determine which kinds of benefits to offer - like heath care, retirement, and PTO. Other state and local laws that have expanded access to retirement plans and paid time off and family leave are all being pressured to expand access to independent worker as well.

    The growth of the gig economy has changed and will continue to change the way we think about work, workplaces, jobs, and careers. It just might also change the way we think about and ensure access to, affordable health care in our country too.

    Have a great week!

    Thursday
    Mar082018

    CHART OF THE DAY: The Rise of the Smart Speaker

    There is pretty good evidence that the rate of mainstream adoption of new technologies is significantly more rapid than it has been in the past. It took something like 60 or 70 years for the home-based, land line telephone to achieve over 90% penetration in US homes once the technology became generally available.

    Fast forward to more recent technology innovations like the personal computer or the mobile phone and time for widespread adoption has diminished to just a couple of decades (if not less for modern tools and solutions like social media/networking apps).

    New tech, when it 'hits', hits much faster than ever before and its adoption accelerates across mainstream users much faster as well. Today's Chart(s) of the Day, courtesy of some research done by Voicebot.ai show just how prevalent the smart speaker, a technology almost no one had in their homes even two years ago, have become.

    Chart 1 - Smart Speaker Market Penetration - US


    About 20% of US adults are in homes that have one of these smart speakers enabled. It may not sound like much, but think about it - how many times had you seen one of these say as recently as 2016?

    Chart 2 - Smart Speaker Market Share - US

    No surprise, to me at least, that Amazon has the dominant position in the US in terms of smart speakers. They beat their competitors to this market, and their platform, Alexa, has become pretty synonymous with the entire voice assistant technology. If I were a company looking to develop solutions for voice, I would start with Alexa for sure.

    Once people, in their 'real lives' begin to adopt a technology solution in large numbers, they begin to seek, demand, and expect these same kinds of technologies will be available and tailored to their workplace needs as well. The data shows that smart speakers like the Echo and the Google Home device are gaining mainstream adoption really, really quickly.

    If your organization has not yet started to think about how to deploy services, information, and access to organizational information via these smart speakers and their platforms like Alexa I wouldn't say you are late, but you are getting close to being late.

    Better to be in front of a freight train rolling down the line than it is to get run over by it.

    Last note - stay tuned for an exciting announcement in this space from your pals at the HR Happy Hour Show.