Quantcast
Subscribe!


Enter your email address:

Delivered by FeedBurner


E-mail Steve
This form does not yet contain any fields.

    free counters

    Twitter Feed

    Entries in data (149)

    Wednesday
    Jun222011

    Disconnect (but rendered in nice colors)

    I sort of think the infographic craze is starting to get a bit played out and certainly a bit overused. But once in a while I catch an infographic, (or in this case two infographics), that whether it is the compelling design or simply the starkness of the data being described I think are worth sharing. 

    Both the below infographics are from the GOOD.is site, and when taken together, they paint a picture of a significant disconnect between the education and demonstrated achievement that today's employers demand, and the stark reality of trends in demographics and experiences in a changing and increasingly diverse population. Take a quick look at the two charts and think about the data for a minute.

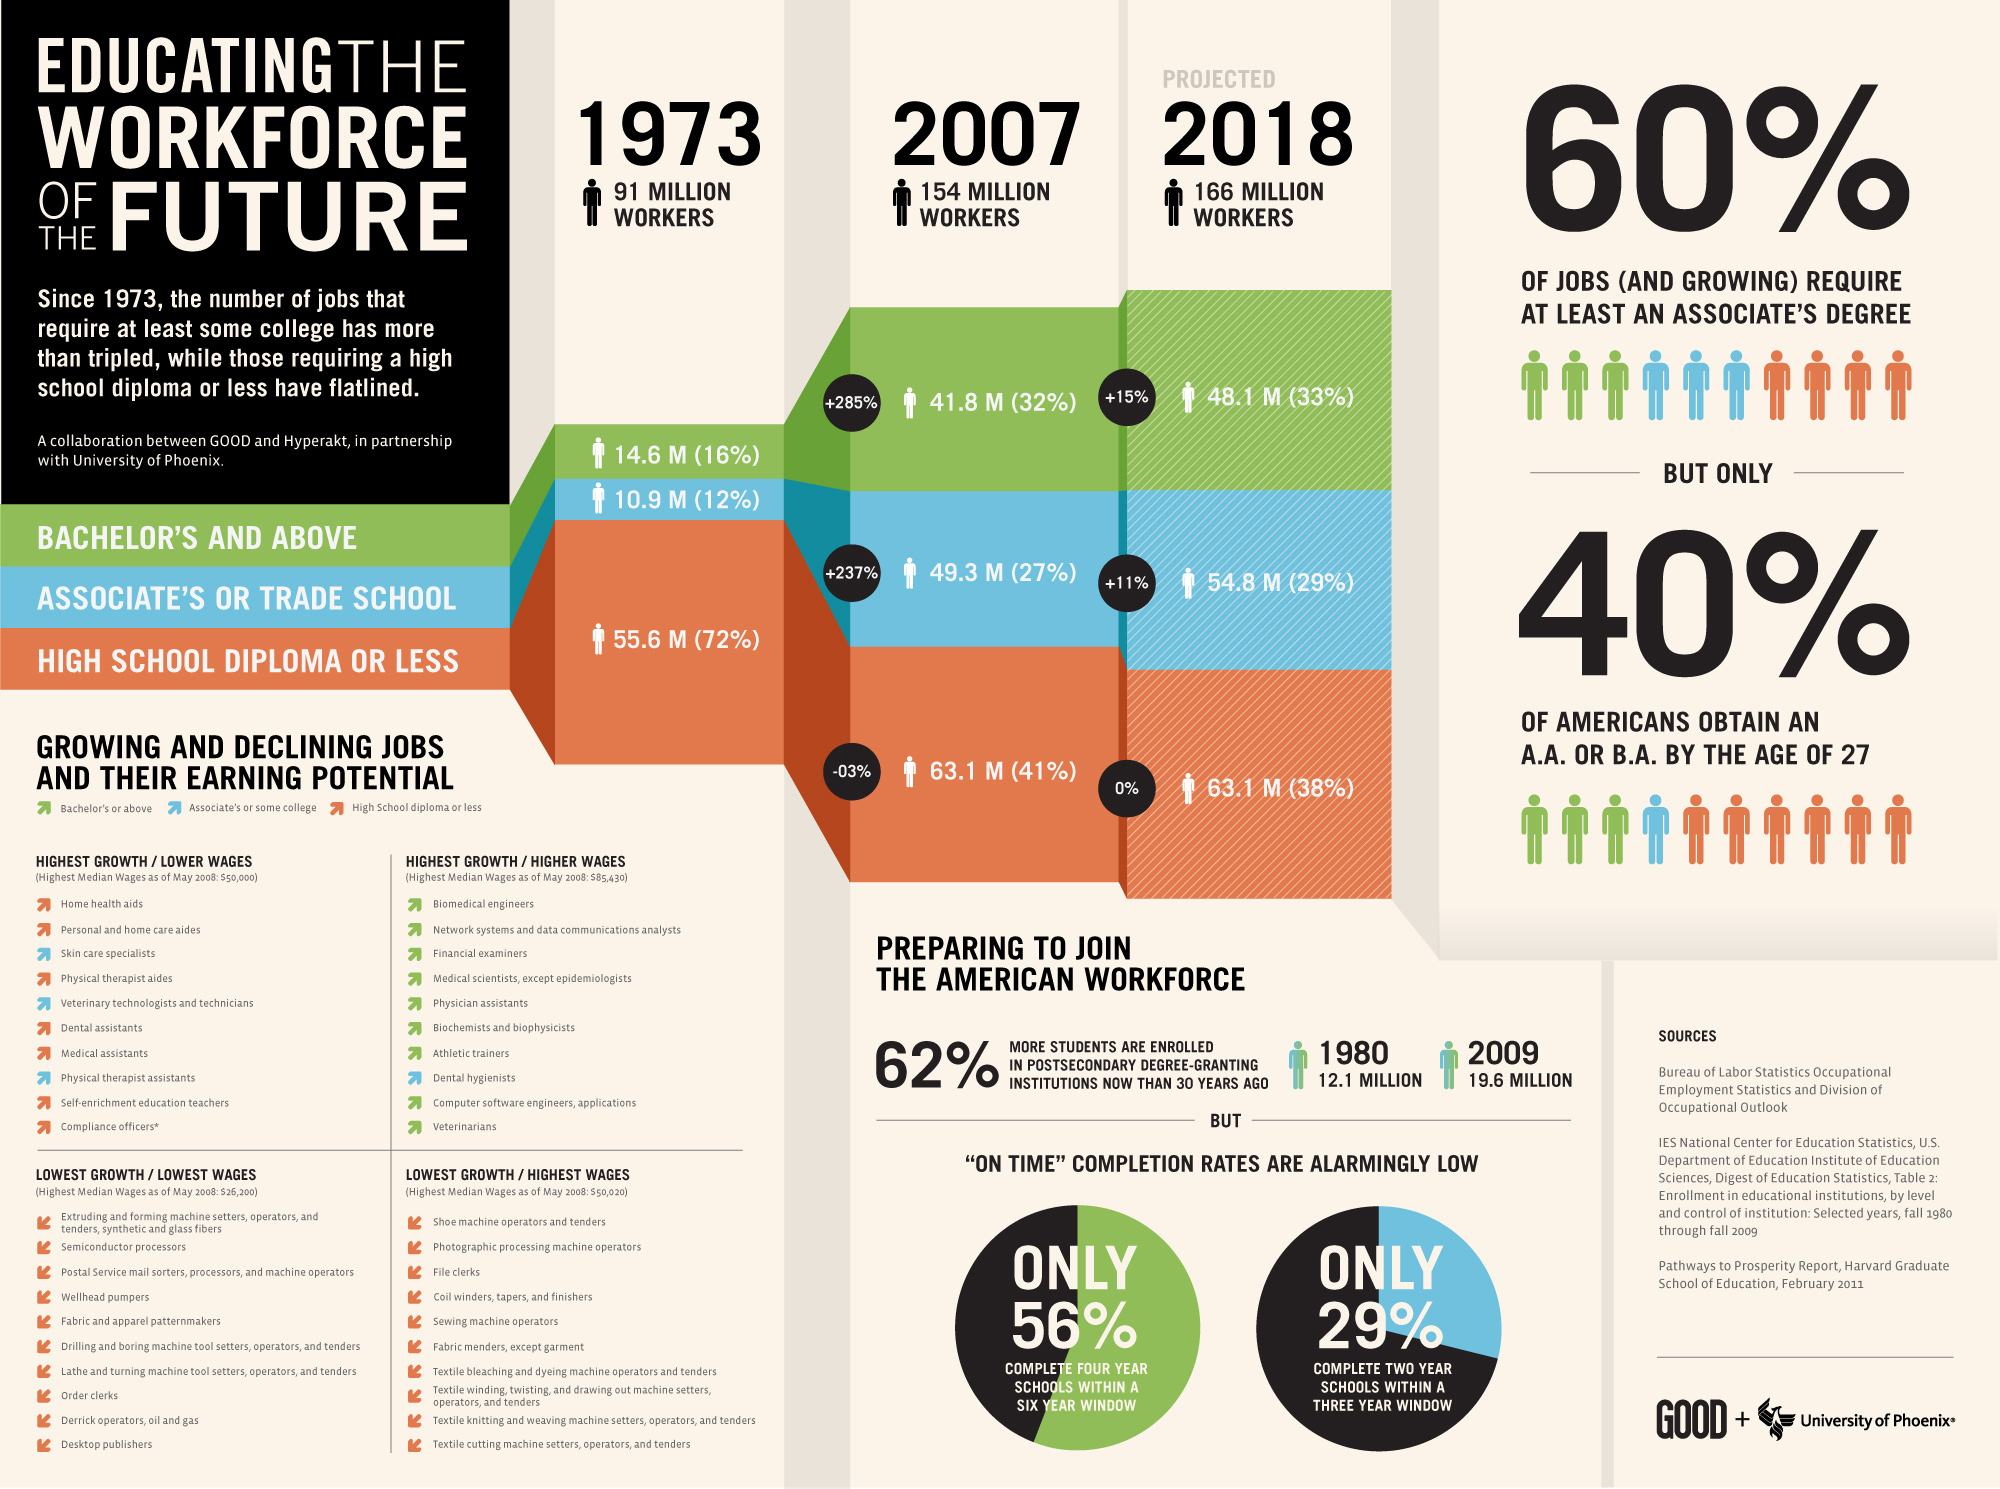
    Chart 1 - Educating the Workforce of the Future (click image to see in full-size)

    Money point : We need to produce significantly more workers with either Bachelor's or at least Associate's or Trade School credentials to meet the expected demand for these skills.

    Source : GOOD.is

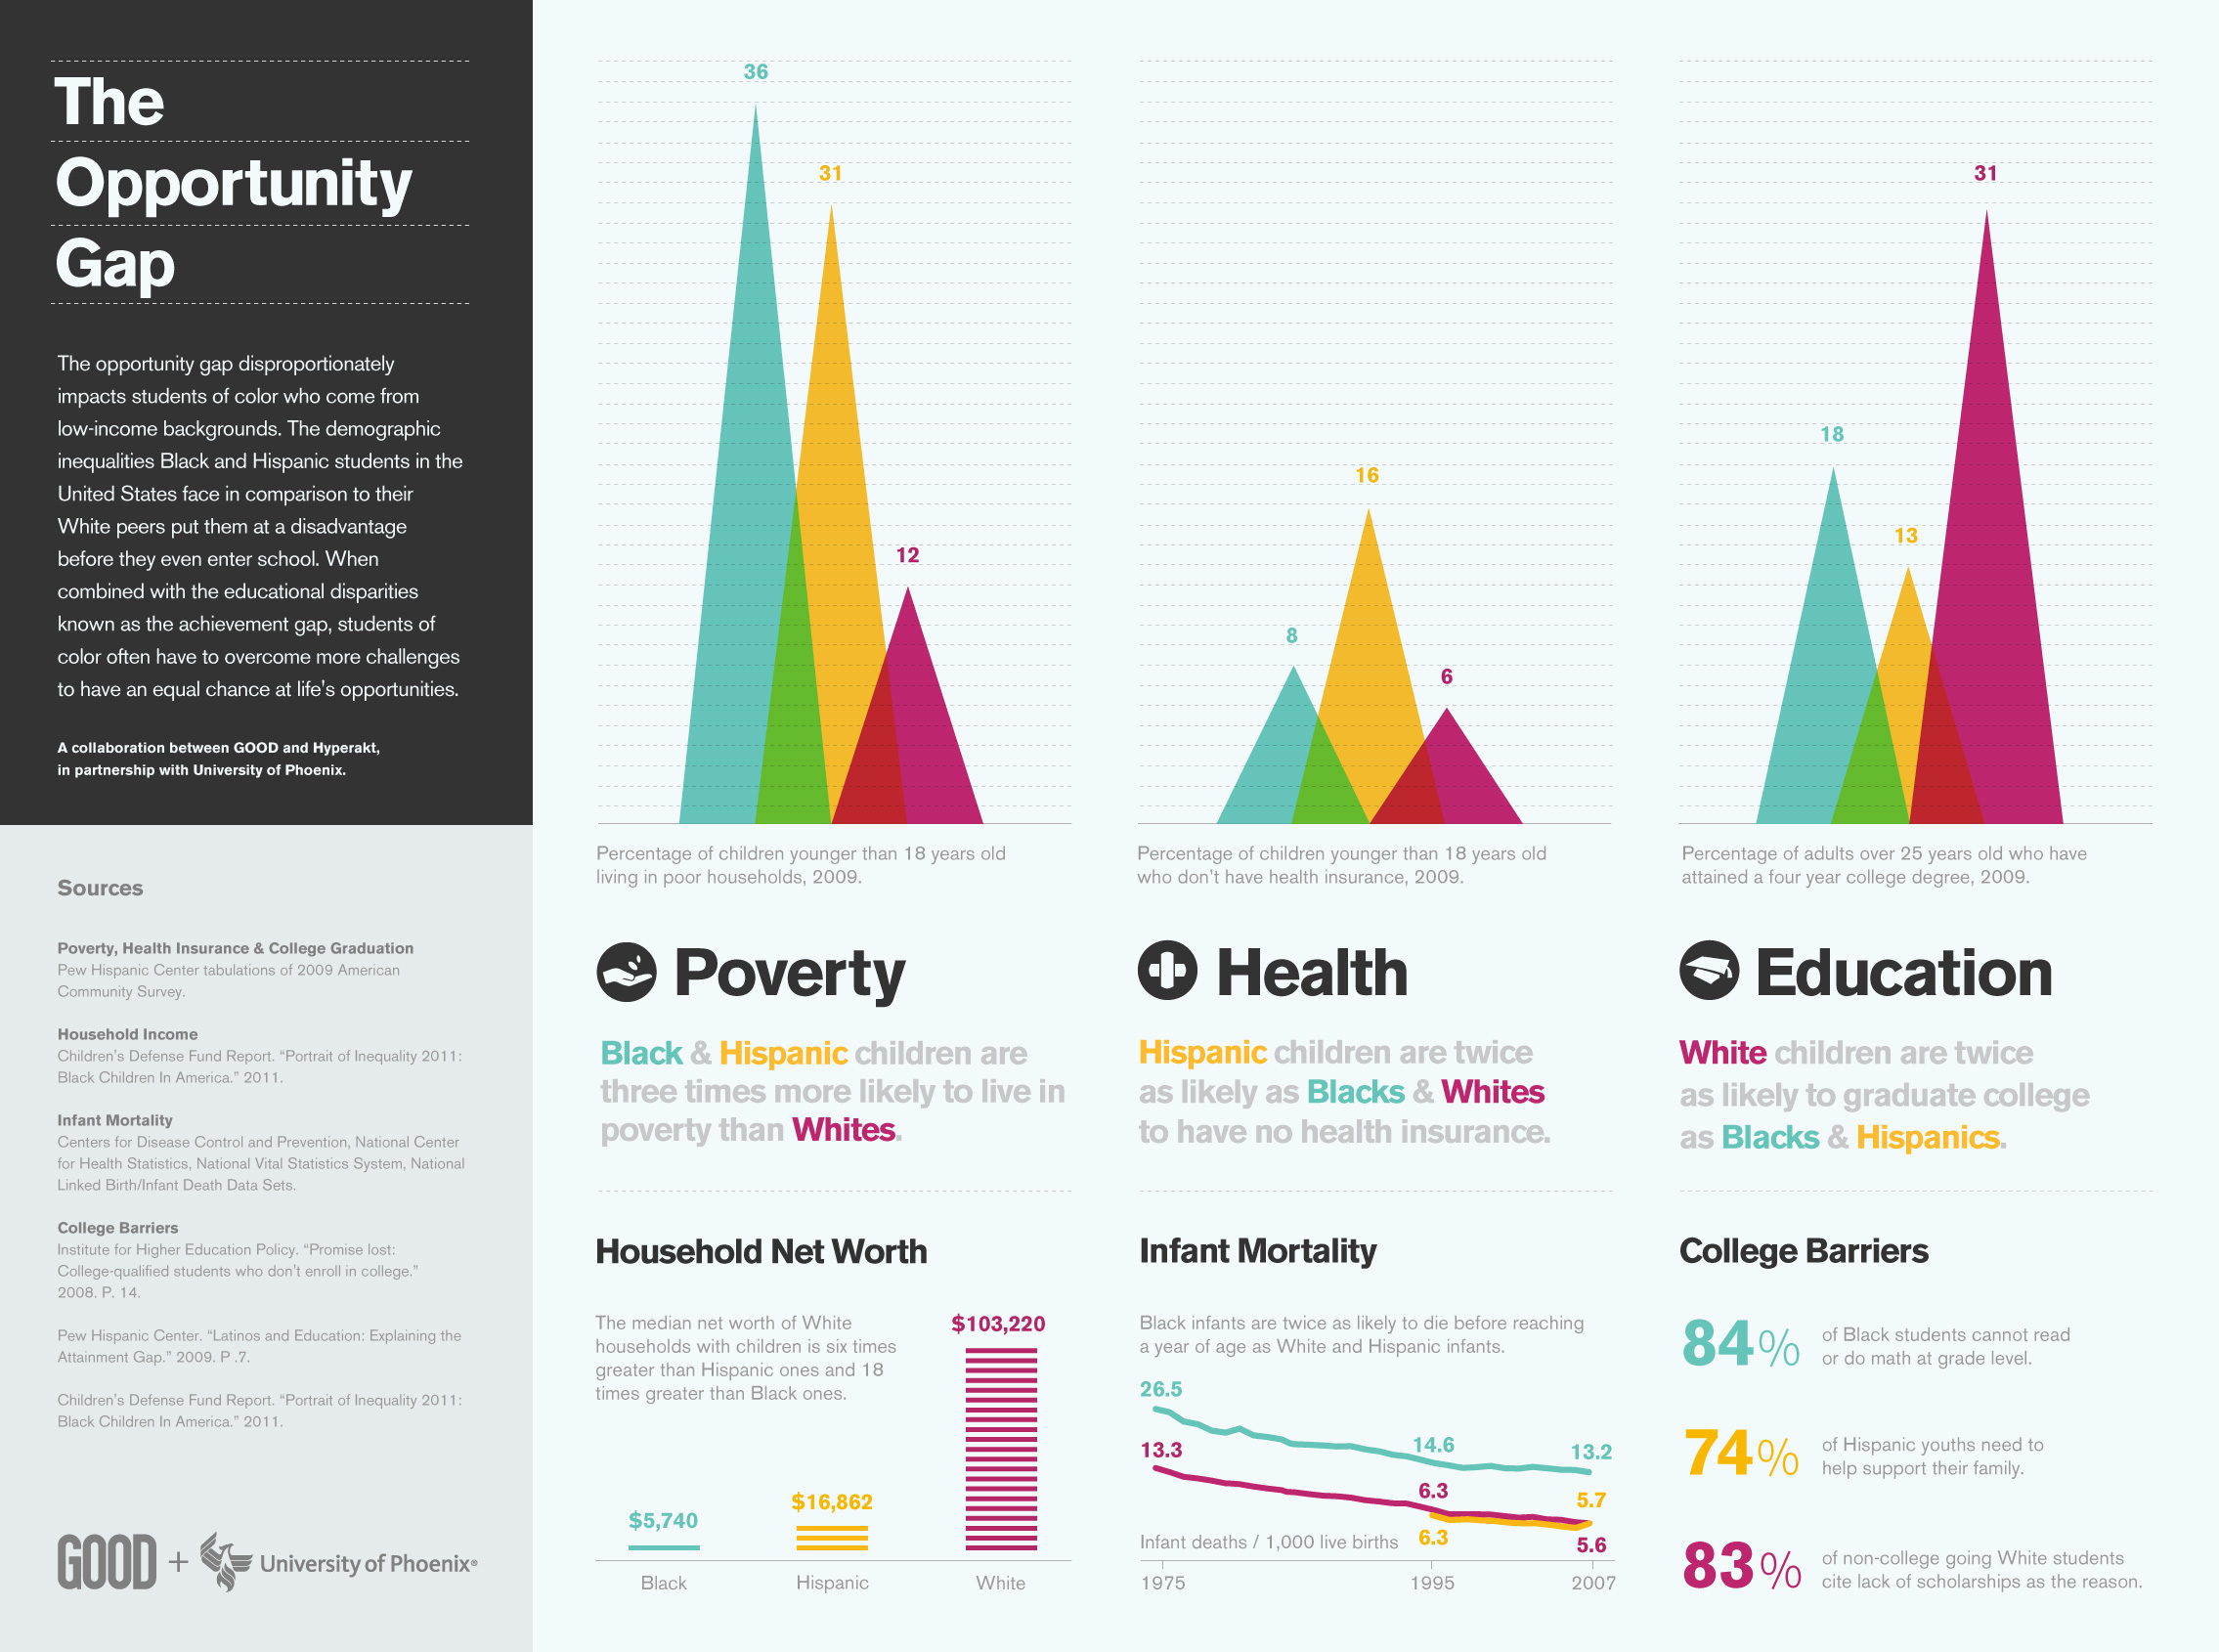
    Chart 2 - The Opportunity Gap (click image to see in full-size)

    Money point : The faster growing segments of our population also have the worst prospects to attain the advanced degrees and certifications that we know the workplace will increasingly demand.

    Source : GOOD.is

    There's an obvious disconnect here between what kinds of education and experiences the future worplace will require, and the ability of the complex combination of primary schools, colleges, trade schools, labor unions, communities, government, and really all of us to provide. It can be argued that on a micro-level that employers can and should relax some of these often artifical educational requirements, and that these kinds of barriers really don't do a great job at helping organizations obtain superior talent. I even took on the subject here once. 

    But even if some employers take steps to expand their thinking around degree requirements there is no doubt that overall, the gap or disconnect in education and skills will persist, and possibly drive even more work, opportunity, and income to other parts of the world that are adapting more rapidly to these changes that we are here in the US. 

    I certainly don't have a simple answer to address these kinds of systemic, structural issues, but I do think that talking about them more is a needed initial step.

    What do you think? What can we do to better prepare for these shifts?


    Hat tip to Bryon Abramowitz whose presentation on these topics at the Aquire Structure 2011 conference put the bug in my ear to start thinking about this topic.

    Tuesday
    May102011

    Brands, Red Gorillas, and Cold Rain

    The new website Brandtoys has introduced what they are claiming is the world's first visualization engine to assess and compare consumer sentiment and the online buzz of brands. The visualization takes the shape of a whimsical character whose physical attributes, (color, shape, size of ears, size of legs, and even surrounding climate), are determined by Brandtoys using source data from consumer surveys and from mining mentions of the brand on the social web.

    The idea being, for example, the more online chatter and buzz about a given brand, that brand's character will be portrayed with large ears; if the online sentiment surrounding a brand skews negative, (think BP), then it will be 'raining' on the brand's character.

    To get a better idea of how this visualization works, take a look at the character for BP, pretty much a globally maligned brand stemming from 2010's Gulf Oil Spill and BP's subsequent handling of the crisis:


    Sort of what you'd expect - BP is characterized as a petulant, angry figure with an aggressive stance, and in the end appears totally unsympathetic or approachable. Persistent (and deserved) negative sentiment about BP produces the rain clouds above our little friend's head.

    Big deal, you may think, who needs a funny character to know that most people don't think all that highly of BP at the moment. But where the Brandtoys approach to the presentation of consumer and online sentiment data is more compelling is in the comparison of competing or adjacent brands (and their derived characters). Then the differences seem to be a bit more subtle and interesting.

    Have a look at the comparison of three similar brands - Miller Lite, Budweiser, and Heineken:


    While the character manifestations of each character are broadly similar, there are a few noticeable and striking differences, the Miller Lite character has much larger ears, signifying a high level of chatter and conversation about the brand; the Budweiser character's eyes are shut, indicating relatively low scores for brand 'charisma'. For a branding or marketing professional, 'seeing' these difference portrayed in this manner is got to be far more resonant than scanning a column of figures on a spreadsheet.

    But beyond being a cool, quirky, and kind of fun site to play around on (I dare you to not spend 5 or 10 minutes creating your own characters), the Brandtoys team emphasizes that the characters are backed by solid and ample hard data and analysis. The larger point to me, and why I decided to write about this site today, is that it reinforces the potential that we have in presenting data in new and innovative ways, ways that can help tell a story, that can enlighten and engage an audience, and are simply a heck of a lot more interesting than another spreadsheet or Powerpoint presentation.

    We have lots and lots of data. You business leaders are likely overwhelmed with the endless barrage of messages they receive each day. 

    What can you do to make your message and the information you are trying to communicate stand out?

    Maybe presenting your analysis with the assistance of a goofy red gorilla is not such a bad idea after all.


    Monday
    Dec272010

    Transforming Data into Information

    Quick one for today, but aimed for anyone in a management or leadership role that has been handed a report, chart, spreadsheet, or pretty much any common or standard style collection of data that is meant to be informative, but really only leaves you asking, 'Just what am I looking at here?'

    I have written previously about incorporating more creative and visually appealing approaches to what is typically flat, and even mundane data, data that really could tell a more interesting, evocative, and relevant story if only it was packaged in a more compelling manner.  So for your consideration, from the always entertaining Information is Beautiful blog, a re-imagining of the simple medical blood test results report checking for c-reactive protein, or CRP.

    The kind of report that contains critical data, that needs to be interpreted, understood by non-experts, and offer the right kinds of recommendations and call to action.  Not unlike the headcount, turnover, and performance management process results that you may read every day.

    The typical CRP test report and the starting point for the redesign looks something like this:

    The redesigned and re-imagined report looks like this:

    All of a sudden, the dull, difficult to interpret, and really sterile data is transformed to a bold, eye-catching, super-informative, piece of actionable information. The re-designed report accomplishes some simple, but important objectives where the old version of the report simply fails to do much of anything except confuse.

    With the new report the patient now can better understand the background and purpose of test, visualize their result compared to norms and averages, provide context to other related and relevant metrics, and finally recommend a course of action (with expected and positive outcomes) based on the results.

    Clearly the redesigned report is an improvement in every way.  I know I have said before, but it bears repeating - most organizations and Human Resources professionals are not suffering from a shortage of data, but rather a shortage of understanding.  Maybe the next 'critical hire' you can get approved shouldn't be another HR Generalist or Recruiter. Maybe a really good graphic designer is what the HR department needs.

    Tuesday
    Nov302010

    Visualizing Performance

    The excellent blog Hoopism manages to successfully combine two of my favorite subjects, basketball and data into an interesting and unique blend of hoops nerd detailed analysis and engaging visualizations.Image - hoopism.com

    Recently on the site the folks at Hoopism created a set of NBA player statistical data visualizations, that were developed by mapping player statistics to physical attributes of simple, cartoon, caricatures (more blocks equals longer arms, more rebounds results in longer legs etc.) 

    An example of one of the NBA player data visualizations is at right.

    The simple representative player caricatures can be evaluated visually, (long arms on the figure indicate a high number of blocked shots), and in comparatively, (the larger the mouth on the figure, indicates relatively more technical fouls assessed against the player). 

    While the actual statistics taken into account on the player data visualizations do not offer what could be considered a total view of statistical performance, or complete insight into what makes for successful and more importantly winning players, the approach the visualizations themselves take offer a couple of important lessons for anyone in the game of understanding and evaluating individual and comparative performance.

    1. Context and Dimension

    These visualizations provide some insight to a player's individual contributions (how big is the player's head), and the relative position of the player compared to his teammates, peers, or competitors. A quick glance at the image above informs the viewer that David Lee scores at a high rate, but compared to Marcus Camby, blocks a relatively low number of opponents' shots.  Understanding and assessing performance for individuals, and in the context of the departmental and organizational units in which they reside is often an important and challenging task in traditional employee performance management. The simple characterizations of the NBA players in the visualizations make a better attempt at this than most workforce systems I have seen.

    2. Eliminates Irrelevance

    While certainly not perfect, or complete, the crude data visualizations do an excellent job at eliminating irrelevant or largely less important information.  Facts like where the player went to college, the number of neck tattoos, or the really subjective 'look' of the player are not included.  If in this case what 'matters' is the actual statistical performance on the court, then anything that is not directly related, and possibly subject to bias (Big 10 players are slow), is left out of the analysis. Again, there are many, many factors to consider in evaluating NBA performance, but I submit that often we allow unimportant factors to cloud our assessments.  In the workplace it is probably no different.  Do we sometimes, almost unconsciously factor in the number of crazy cat pictures that a colleague has in her cube to influence how we evaluate her work and contribution?

    3. Fun

    I simply like how the data visualizations introduce a novel and fun way to look at very traditional and typically flat data. By creating the caricatures and linking the familiar stick figure forms with the player statistical information, the creators make this performance data much more accessible.  You don't have to know too much about basketball to be able to quickly grasp the performance information, and begin to gain an understanding of individual and relative player strengths and weaknesses.  And finally, it is simply cool to look at this data in a new way.

    We have loads of data in the organization.  Truly, there is no shortage of financial, operational, and employee data.  The challenge is finding ways to make the data meaningful, relevant, accessible, and perhaps even fun.  The ideas from some simple NBA player data caricatures I think offer some clues as to how we may approach these challenges.

    Page 1 ... 26 27 28 29 30