CHART OF THE DAY: The U.S. Uninsured Rate
With all the news and talk and debate about the ever evolving and complex set of requirements on organizations (and individuals) from the Affordable Care Act, it seems to me that one (fairly important) macro statistic often goes underreported, namely the percentage of people in the U.S. who still lack medical insurance.
If you had to guess, (don't peek at the chart below), what would you guess the percentage of U.S. adults uninsured to be?
It feels like it should be kind of high, right? Maybe 25% or 30%?
But you'd also guess that with the opening of the ACA exchanges late in 2013 and with all the news and attention surrounding getting folks to navigate the buggy Healthcare.gov website and actually getting them enrolled in Medical coverage, that the uninsured rate should be dropping I would bet.
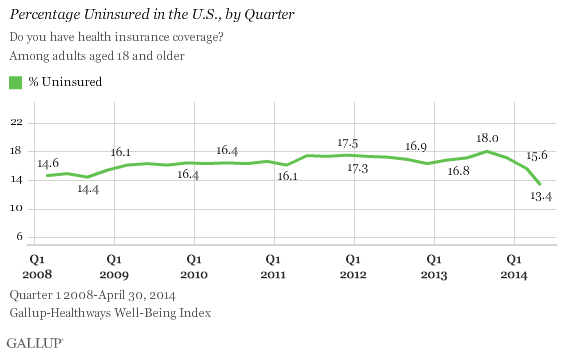
So what's the actual/estimated rate of uninsured adults in the U.S.? Check out the below chart from Gallup from their survey of 14,700 people in April 2014:

So according to the Gallup survey, the uninsured rate among U.S. adults sits at 13.4% and does show a gradual decline since the launch of the ACA exchanges. When I first saw the chart and the 13.4% figure, I felt it was kind of low, I am not sure why. It just 'felt' like there would be more uninsured folks than that.
The Gallup survey also breaks down this data into age/income groups, (click here for those details), but essentially they reflect what you'd expect - older, wealthier people are much less likely to be uninsured than younger and poorer people. But the trends in getting more people insured are improving across all age cohorts, which seems like a good thing.
I suppose I don't have any big lesson/takeaway from all this, just thought it was interesting.
Happy Thursday.

 Steve
Steve
Reader Comments (2)
Yes, it's okay. Not as good as hoped for. I feel like it could go either direction by this time next year. Maybe it is just something that changes slowly. Esp, if people who have typically not had health insurance adjust to it slowly.
Thanks Chad - it just struck me as seeming low, even if it is not really low if that makes sense. I guess I never really thought about it before.