Quick update for a busy, cold Monday in the Northeast. Over the weekend while enjoying my typical evening of NBA League Pass and catching up on some reading, I ran into this excellent piece on the Behavioural Investment blog titled 'Can More Information Lead to Worse Investment Decisions.'
In the piece, author Joe Wiggins references a research study titled 'Effects of Amount of Information on Judgement Accuracy and Confidence' that was published in 2008 in the academic journal Organizational Behavior and Human Decision Processes, (I trust you are all up to date on your stack of these journals). Long, (really long) story short, the researchers found that having more information available that was meant to help subject make decisions had interesting and counter-intuitive effects. Essentially, more information did not increase the quality of decision making in a significant way, while at the same time increasing the subject's level of confidence in their decisions, which as we just noted, did not in fact get any better.
Here's a simple chart from one of the experiments showing what happened to decision quality and subject confidence when more information and data about the decision was made available to subjects.
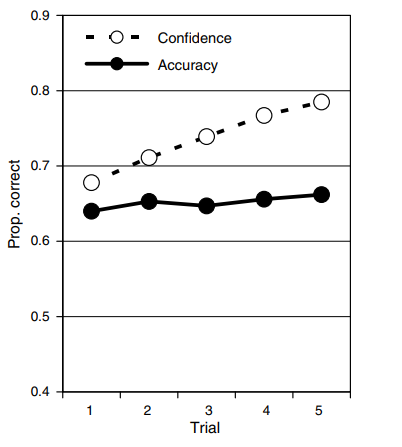
The data above shows how subjects in the study had to forecast a winner for a number of college football games based on sets of anonymised statistical information about the teams The information came in blocks of 6 (so for the first trial of predictions the participant had 6 pieces of data) and after each subsequent trial of predictions they were given another block of information, up to 5 blocks (or 30 data points in total), and had to update their predictions. Participants were asked to predict both the winner and their confidence in their judgement between 50% and 100%. The aim of the experiment was to understand how increased information impacted both accuracy and confidence in their decisions/predictions.
Joe at Behavioural Investment sums up the results of the experiment really well:
The contrasting impact of the additional information is stark – the accuracy of decision making is flat, decisions were little better with 30 statistics than just 6, however, participant confidence that they could select the winner increased materially and consistently. When we come into possession of more, seemingly relevant, information our belief that we are making the right decision can be emboldened even if there is no justification for this shift in confidence levels.
A really important reminder and a kind of a warning for any of us, say in HR in 2019, who are increasingly seeking to and are more able to gather more and more data and information to use and apply in HR and talent decision making. If more information does not always, (or maybe ever), lead to better decisions, then we need to be really much more careful how we plan to gather, process, and apply data for decision making.
The most basic takeaway from this kind of study is that we probably need to spend much more time thinking about what data and information is meaningful or predictive towards making a decision, rather than increasing our efforts to simply gather more and more data, from all the possible available sources, under the probably false impression that more = better.
There are plenty of reasons why we are inclined to gather more data is we can - we might not know what information is actually relevant, so we look to simply collect data, we want to show we did a lot of research before taking a decision, or we want to be more comfortable with our decision if it is supported by more data.
But I think it's best to start small with our data sets we apply to decisions, take time to test if the data we already possess is meaningful and predictive before chasing more data for its own sake.
Ok, that's it, I'm out - have a great week!


 Steve
Steve