CHART OF THE DAY: The End of Soda (or Pop, if that's how you roll)
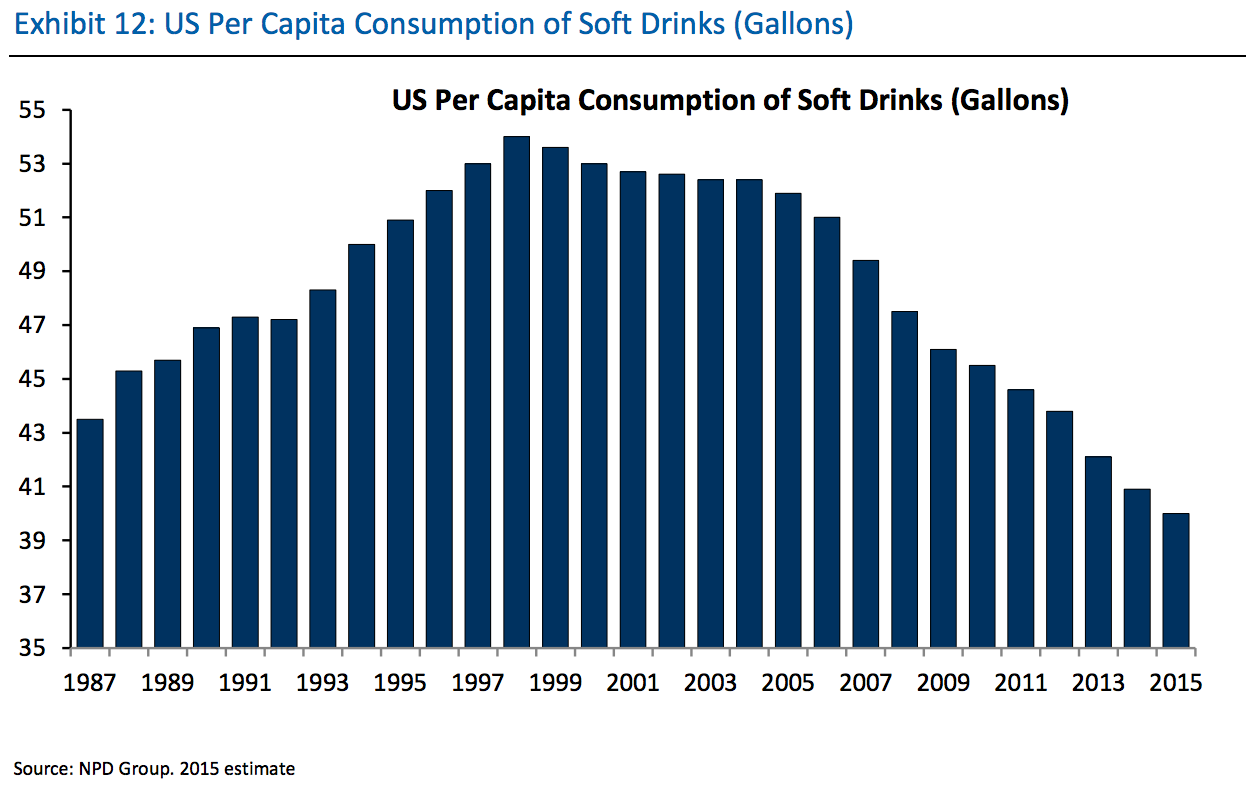
Quick shot for a busy Friday, today's chart is from our pals at Business Insider and shows what BI calls an 'epic' (I'd say it is more 'moderate') decline in per capita soda (or pop) consumption in the USA over the last 18 years.
Here is the chart, and after that, as always, some FREE commentary from me after the data:

The headline number is that per capita soft drink consumption has declined from a peak of 53 gallons in 1997 all the way down to 40 gallons in 2015. So just about a 25% decline. Still 41 gallons is a lot of soda, (observed as I down my second Diet Dr. Pepper of the day).
Why is this important? I am note sure it is, but to me it is at least interesting.
Could it be, at least by this one measure, the public is finally getting more concerned about the ill effects of the consumption of empty calories from sugary drinks? Or maybe the focus on employee wellness and well-being by lots and lots of organizations is having a positive impact on people's habits with respect to soft drink consumption? Perhaps it's a generational thing. Do 14 year olds like to drink Coke or Mt. Dew?
Of could it be a simple lack of innovation by the soft drink makers themselves? After all, while we love and praise innovative companies, the second that Coke or Pepsi messes about with the formula or our favorite drink the backlash is immediate and the outrage is enormous.
Who knows for sure? But as an observer of the world, I find it interesting for sure. Perhaps you do as well.
Have a great weekend!

 Steve
Steve
Reader Comments (1)
Nothing about shifting to energy drinks/coffee? My own experience shows that many "utes" are drinking energy drinks and coffees (desserts with caffeine from Starbucks) in lieu of soda pop.