Quantcast
Subscribe!


Enter your email address:

Delivered by FeedBurner


E-mail Steve
This form does not yet contain any fields.

    free counters

    Twitter Feed

    Entries in demographocs (8)

    Wednesday
    Jul052017

    Who we spend our time with

    Quick one for a first day back after a long weekend Wednesday.

    Wanted to share a really interesting chart I saw over the weekend from The Atlas who took a look at data from the American Time Use Survey to see how who we spend our time with, (co-workers, family, no one), changes over time. Or more clearly, how who we spend our time with changes as we get older.

    Take a look at the chart, then one or two comments from me.

    Nothing too surprising here, I guess. As we get older we spend less time each day with co-workers, (we may not even have any), children, (on to their own lives), and siblings, (the same). We tend to spend relatively more time with a partner, (if we have one), and most troubling, more and more time alone.

    I guess that is the natural way of things, but it still feels a little sad. We look forward to the time when we don't have to go to the office to deal with our annoying co-workers. To the time when the kids finally move out of the house so we can have our space. To the day when we don't have anyone really chasing our time and attention. 

    But pretty quickly that can turn into something else, something not so fun, something we probably don't think about too much right now when our lives are so full, so busy, so crowded.

    Look at the charts above again. Look at the 'Alone' chart. Up and to the right. Up and to the right. 

    It's the only chart wth that trend line. Until the line ends of course.

    Wednesday
    Jun142017

    CHART OF THE DAY: The Aging Global Population

    I am just back from an extended trip that included stops in China for HR Tech China as well as Japan - two places, Japan in particular, who are dealing with the economic and social challenges of an aging population.

    Usually the 'aging' statistics of a country's people is represented by two statistics. One, the percentage of the population age 65 or older. And two, the ratio of people aged 18-64, (and expected, mostly, to be in the workforce), to people 65 and up, (who, mostly, are no longer in the workforce). This ratio is called the 'dependency ratio' and reflects about how many workers and contributors to a country's social insurance schemes are there for each possibly retired person, many of who need income support from these social programs. 

    Said differently, the higher the ratio, the more workers for each older person, the easier it is for a country to keep their social insurance programs funded and solvent.

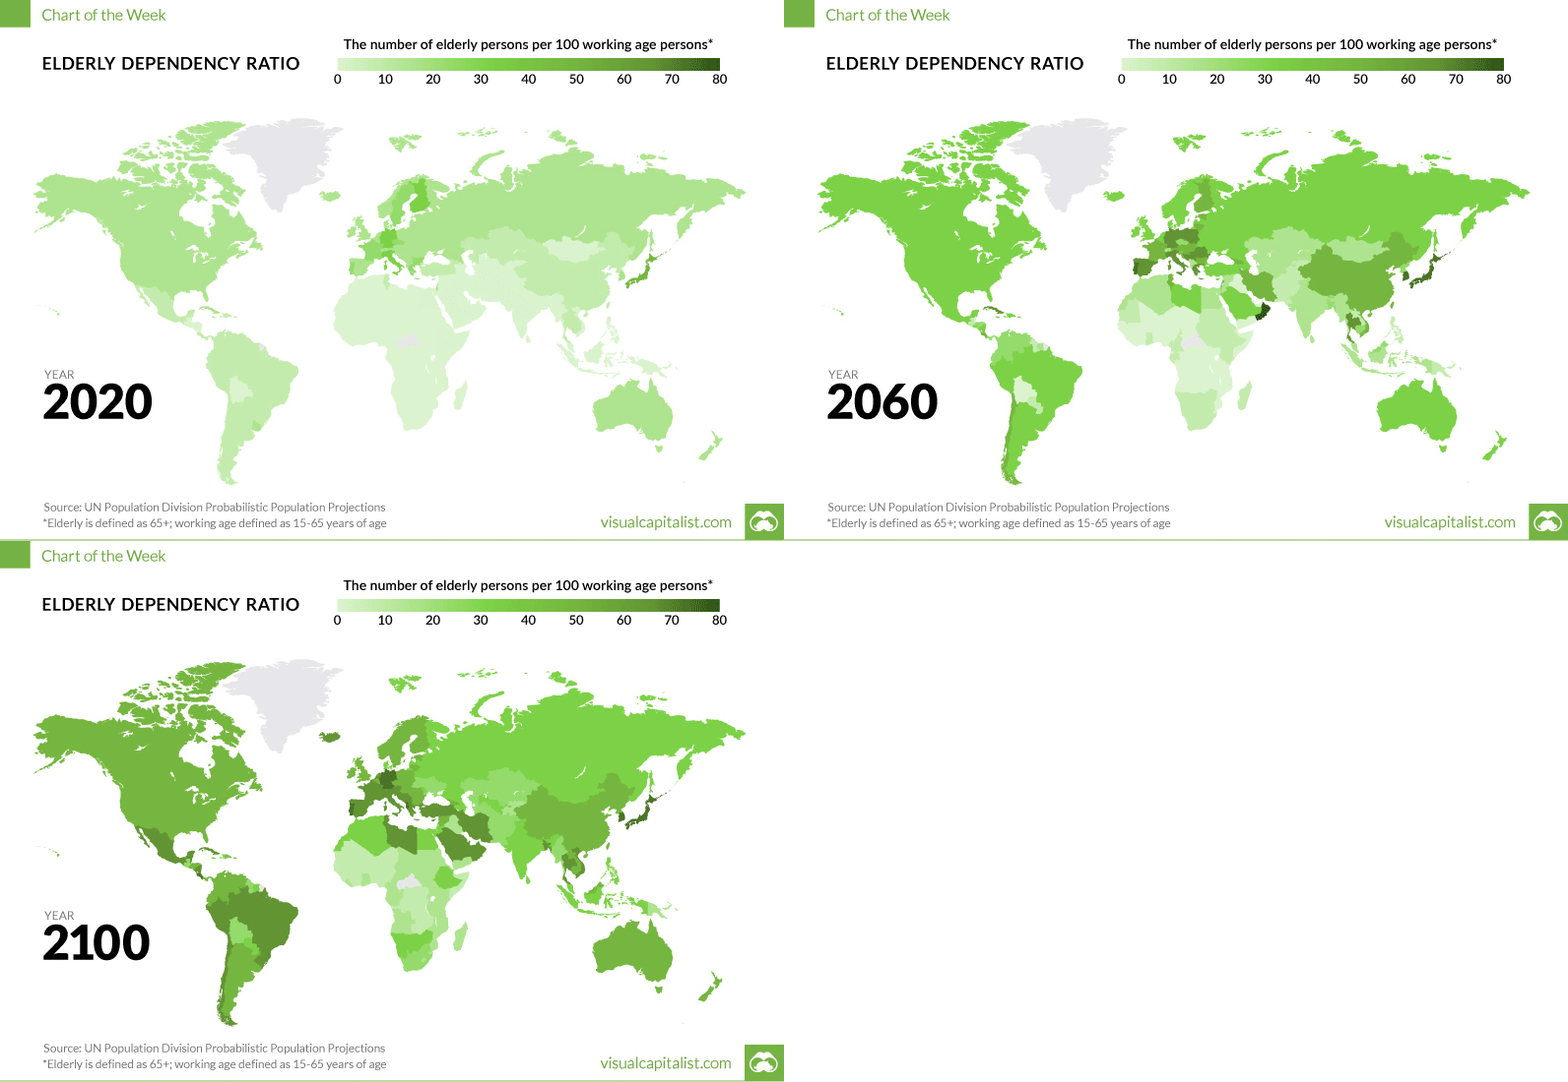
    With all that said, I was thinking about this more lately after spending time in Japan, where this challenge is especially acute. But as the data below shows, this challenge of an aging population is more widespread than you might think - and, in time, will surface here in the US as well.

    Take a look at the data below on the dependency ratio worldwide, courtesy of Visual Capitalist, then some FREE comments from me after the chart:

    While many countries face obstacles with aging populations, for some the problem is becoming severe.

    A dependency ratio below 5.0 is generally considered to be the mark by which a country has an 'aging' challenge. Countries like Japan, Italy, Germany, Canada, France, and the United Kingdom all fall below this level.  The United States sits in a slightly better situation with about 27.9% of its population expected to hit 65 or higher by the 2050 – and a dependency ratio of about 9, but in time the US (and the 2nd largest global economy, China), will both face looming demographic issues.

    What does this mean or suggest for organizations and for HR pros?

    Well, depending on the location, industry, and global nature of your business, chances are pretty good that the average age of the workforce is trending up. And it is also likely that since your competitors will be facing these same kinds of challenges that the competition for newer/younger workers to replace retirees or folks transitioningto fewer working hours will become more intense. Lastly, you may sooner than later be forced into thinking about and implementing changes to work practices, structures, and technologies that can better support an older workforce.

    It is an interesting time for sure. I am feeling a little older each day. Good to know it is not just me.

    Have a great day!

    Tuesday
    Apr262016

    CHART OF THE DAY: Trends in Labor Force Participation

    It's been ages since I broke off a CHART OF THE DAY post and even longer since I talked about the Labor Force Participation Rate, so let's remedy both of these situations in one shot.

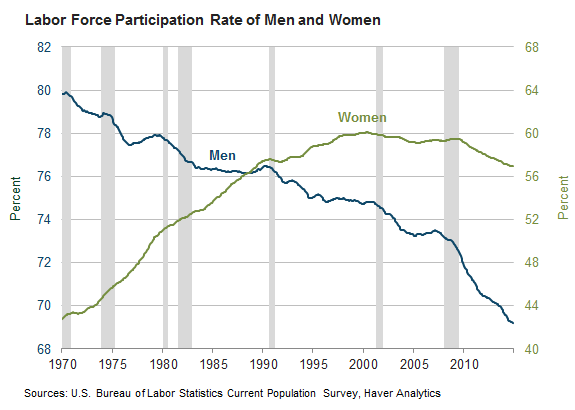
    Courtesy of your pals at the Federal Reserve Bank of Atlanta, have a look at a recently published chart on participation, this one broken down by gender. As always, some insightful comments from me after the data:

    Let's break down the data a little, and see if we might (Shock!) learn something. Some observations...

    1.  Male labor force participation has been on a long and steady decline for ages. In fact, males, as a group, have been less and less inclined to participate in the labor market since at least World War II.

    2. The female participation rate increased from about 43 percent in 1970 to a peak of 60 percent in the late 1990s, from which it has remained relatively flat over the last 15 - 20 years.

    3. But despite the economic recession of 2007 - 2008 ending, the data show that between 2010 and 2013, participation declined even more steeply for both men and women. Average female participation in 2014 was 57 percent—the lowest level since 1988—and male participation was down to a record low of 69 percent.

    What should we think about when considering this data? After all, participation is influenced by numerous factors like workforce age, prospects, disability rates, desire to continue schooling, etc.

    Let's look at what the Atlanta Fed thinks is the near-term direction for Labor Force Participation:

    "As a guide, the Bureau of Labor Statistics projects that the factors pulling down the labor force participation rate will outweigh those pushing it up, and that by 2022, labor force participation will be 61.6 percent, 1.4 points below its level at the end of 2014."

    The trends and the predicted continuation of these trends suggest a labor market that is even tighter than we are experiencing currently. It seems also likely that the kinds of jobs that will be hardest to fill are not the ones that will be easily filled by simply coaxing more people back into the labor force. 

    If anything, a declining participation rate makes even seemingly 'easy' to fill jobs that much harder to fill.

    Long story short, this data suggests that filling all kinds of jobs is just going to get tougher. It's probably a good time to be a recruiter though.

    A good recruiter I mean.

    Tuesday
    Dec082015

    CHART OF THE DAY: We can FINALLY stop talking about millennials

    In what has to be interpreted as a signal to the tens of thousands of workplace/leadership/management professional speakers and pundits out there that it is time (finally), to update those PowerPoint decks from 2009, it looks like we need to stop or at least slow down our collective fixation with Millennials.

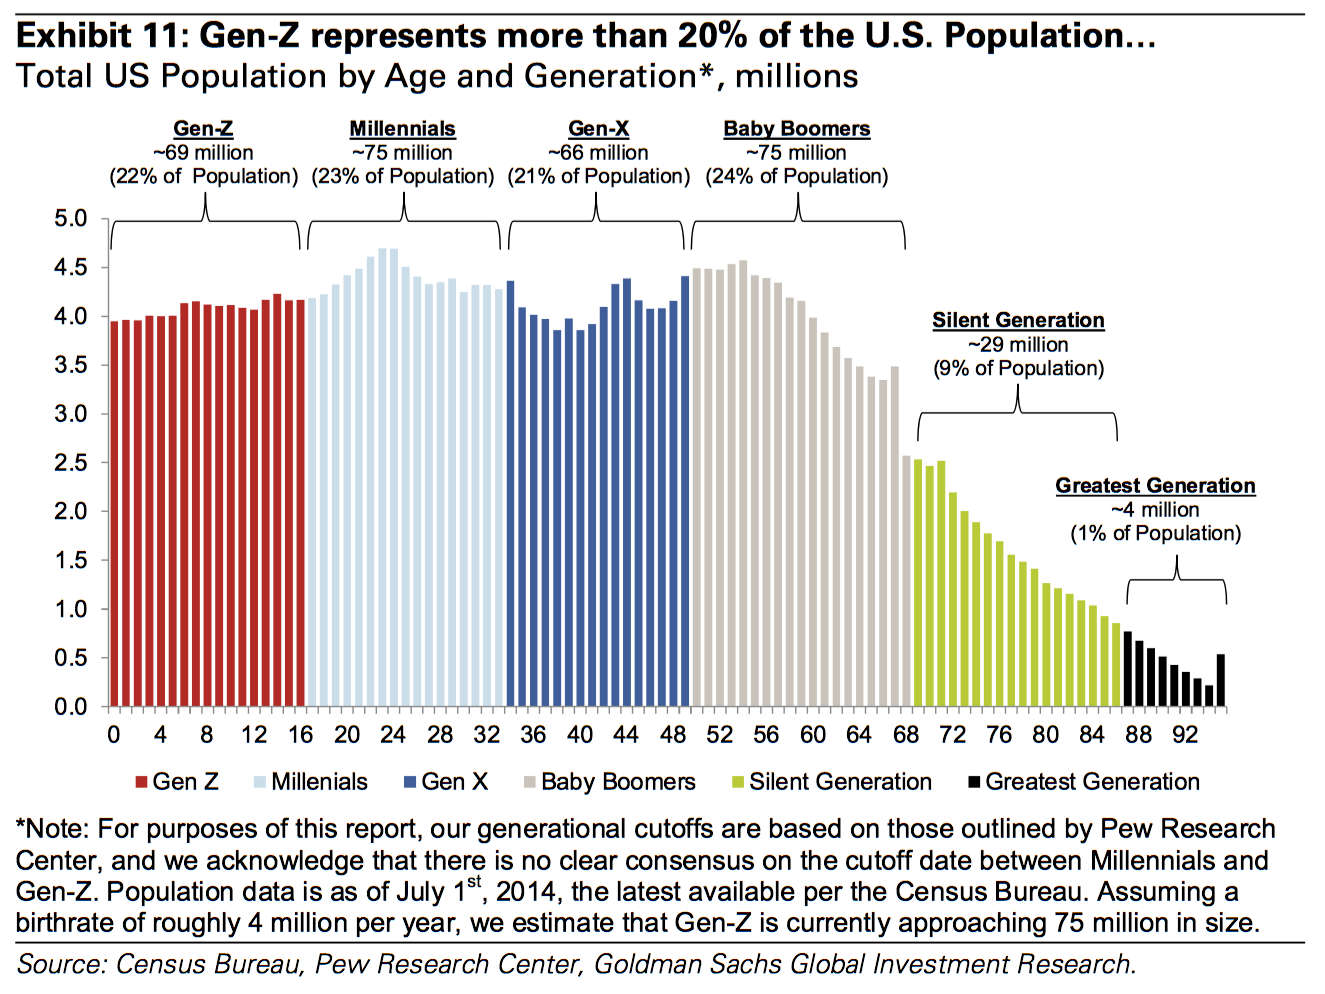
    Take a look at today's Chart of the Day, courtesy of the fine folks at Goldman Sachs and let's together pour one out for the Millennials and raise one up for what is coming next. Here's the chart and as you have persistently demanded, some comments from me after the data:

    Awesome looking chart, right? And from the looks of it, it is time to stop worrying so much about the Millennials and start thinking about Gen Z! What might this mean to the rest of us - besides all the 'Generations in the Workplace' people that need to update their slides I mean?

    I have three quick takes, then like the Good Gen X-er I am have to go make the donuts...

    1. Technology - this is the first 'post-internet' generation. They have never known a world without almost constant connectivity, ubiquitous wifi, and life attached to their devices. Waiting for any kind of information is something they are not used to, nor will tolerate very well. Everything has to move faster, be more easily consumable, and actionable. If you thought the Millennials were annoying, just wait until your first set of Gen Z employees comes through the doors, (very soon), and laughs at your antiquated set of systems and processes.

    2. Diversity - In line with the increasing diversity in the population overall, Gen Z will be the most diverse generation in US history. According to Goldman, the majority of Gen Z will be non-white by 2020 or so. And with this diversity in composition, it seems likely that Gen Z-ers will also be the most accepting of diverse workplaces and teams. In fact, many of them will not even consciously think about 'diverstiy' in the ways that Gen X and Boomers always have, (and have needed to). To Gen Z, the team won't really seem 'diverse', it will just seem like 'the team.' I am not smart enough to know exactly what that means for corporate diversity and inclusion efforts, but I bet it will mean something.

    3. Backlash - In about three minutes from now, someone will take a shot at me or at this post for 'generalizing about the generations'. This person will probably be an older Gen X-er or possibly a Boomer. These people are cranky and should be ignored. Yes, I know not every Gen Z-er is the same and not every Boomer is some kind of Luddite. EVERYONE knows this. The point of talking about generational groups and trends is not to try to explain the motiviations and actions of EVERY SINGLE PERSON IN THE WORLD. The point is to try and make sense on a macro-level of how the shared experiences and enviroments of people who grow up in similar cultural, societal, and economic circumstances impact how they see the world and what that means for the world. And I think having that kind of understanding, or at least having the discussion, is important and valid.

    Ok, that's it from me. What say you? Do you care about Gen Z at all? Or are you happy (like I am), not to have to figure out how to spell 'Millennial' all the time?

    Friday
    Feb282014

    WEEKEND READING: On Age and Scientific Genius

    Building on one of the themes of the blog, i.e., the changing nature, demographic and otherwise of the modern workforce, I submit for your weekend long-reading consideration a recent National Bureau of Economic Research working paper titled Age and Scientific Genius, by Benjamin Jones, E. J. Reedy, and Bruce A. Weinberg.

    In the paper, the authors examine the relevant literature to determine the relationship, if indeed one exists, between age and great scientific discovery, or 'genius.' Note: Nobel Prizes and great inventions are used as proxies for 'genius' in this analysis.

    Turns out there is a relationship, and it might be a little different than your think, and most interestingly, it might be changing.

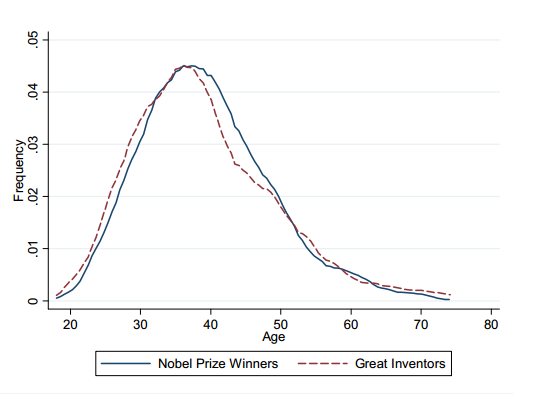
    Take a look at the first of two charts from the paper. First, the 'headline' chart tracking 'genius' against age:

    So genius peaks at about 40 or so, then literally and figuratively falls off a cliff as we age.

    That can't be good news for one, many of the folks that are reading this post; and two, for workplaces overall that as we have explored before here on the blog, are more and more comprised of 'older' workers.

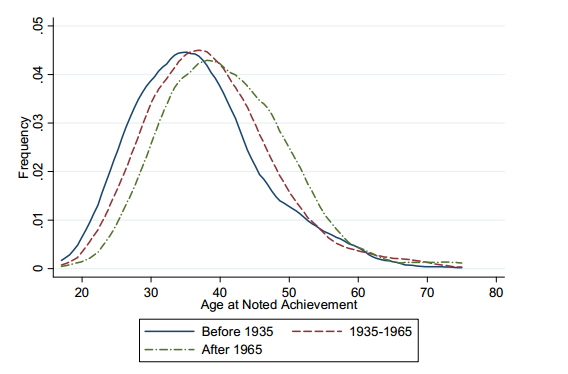
    But maybe the news is not all bad for those 40-plussers. Take a look at how the genius/age relationship is changing over time.

    According to the researchers, and like everyone else, geniuses are getting older.

    Or said differently, geniuses used to be younger. The peak age for great scientific achievements keeps moving to the right of the curve, particularly since 1965.

    So if this trend continues, maybe it is good news for those of us staring at, or even looking back upon, our peak genius years.

    On Age and Scientific Genius is an interesting look at the effects of time and generational shifts on the production of great scientific work. Take a look at the paper over the weekend if you have some time, I think even you can spare a few minutes before getting back to the workshop or laboratory.

    Have a great weekend!