Quantcast
Subscribe!


Enter your email address:

Delivered by FeedBurner


E-mail Steve
This form does not yet contain any fields.

    free counters

    Twitter Feed

    Entries in work (243)

    Friday
    Feb282014

    WEEKEND READING: On Age and Scientific Genius

    Building on one of the themes of the blog, i.e., the changing nature, demographic and otherwise of the modern workforce, I submit for your weekend long-reading consideration a recent National Bureau of Economic Research working paper titled Age and Scientific Genius, by Benjamin Jones, E. J. Reedy, and Bruce A. Weinberg.

    In the paper, the authors examine the relevant literature to determine the relationship, if indeed one exists, between age and great scientific discovery, or 'genius.' Note: Nobel Prizes and great inventions are used as proxies for 'genius' in this analysis.

    Turns out there is a relationship, and it might be a little different than your think, and most interestingly, it might be changing.

    Take a look at the first of two charts from the paper. First, the 'headline' chart tracking 'genius' against age:
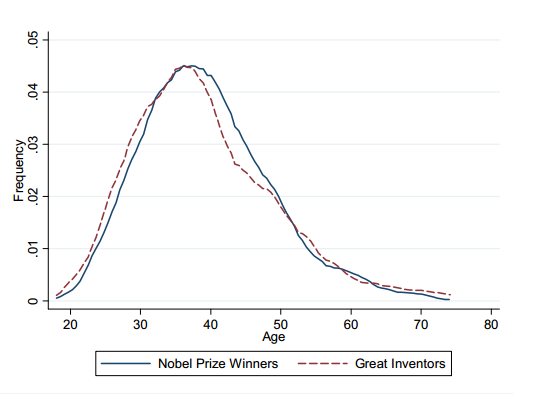
    So genius peaks at about 40 or so, then literally and figuratively falls off a cliff as we age.

    That can't be good news for one, many of the folks that are reading this post; and two, for workplaces overall that as we have explored before here on the blog, are more and more comprised of 'older' workers.

    But maybe the news is not all bad for those 40-plussers. Take a look at how the genius/age relationship is changing over time.
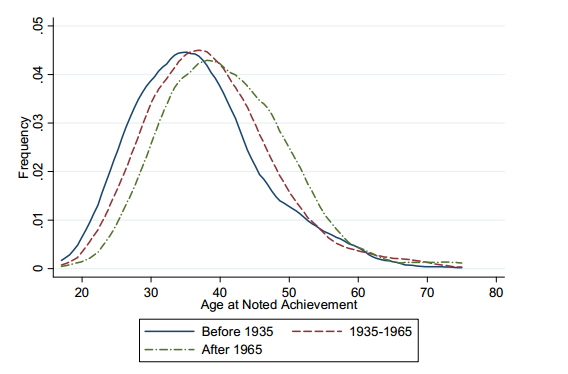
    According to the researchers, and like everyone else, geniuses are getting older.

    Or said differently, geniuses used to be younger. The peak age for great scientific achievements keeps moving to the right of the curve, particularly since 1965.

    So if this trend continues, maybe it is good news for those of us staring at, or even looking back upon, our peak genius years.

    On Age and Scientific Genius is an interesting look at the effects of time and generational shifts on the production of great scientific work. Take a look at the paper over the weekend if you have some time, I think even you can spare a few minutes before getting back to the workshop or laboratory.

    Have a great weekend!

    Wednesday
    Feb262014

    CHART OF THE DAY: The Return of the Quit

    Since many of us in the USA have been a little preoccupied with the relentlessness of global warming that has cleverly disguised itself in the form of the coldest, snowiest, most miserable winter ever, you'd be excused if you didn't notice a little phenomenon or trend developing in your workforce reports and analyses.

    Employees are quitting again. 

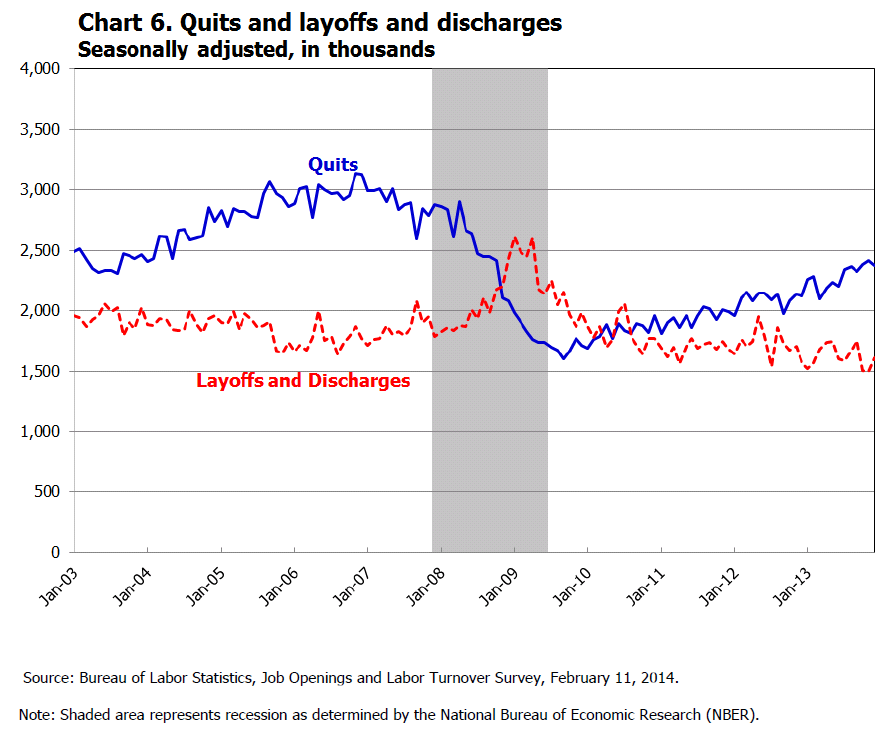
    Well, to be fair, employees always quit, even in bad economic times. But take a look at today's Chart of the Day, from the Bureau of Labor Statistics year-end JOLTS (Job Openings and Labor Turnover Survey) report which suggests that the 'quit rate', i.e. the voluntary separations as your HRIS probably calls them, is trending higher and higher.

    Here's the chart, and then (of course), some FREE commentary from me:

    Source - BLS Jolts report Dec 2013

    Some thoughts:

    1. 'Quits' are a function of several factors, (personal circumstances, the magnitude of the jerkitude of your managers, people self-selecting out as not being in the right job, etc.), but most observers of the Quit rate on a macro level ascribe movements in the rate to worker's confidence in their ability to find another, and what they think will be a likely 'better', job.  The rate moving up, to a level that is approaching the pre-recession level, is a signal that overall job market confidence is rising.

    2. So while you and many other HR/Talent pros are lamenting about 'hard-to-fill' jobs, simultaneously more of the workforce are thinking of themselves as 'easy-to-place'. I'm not sure how that apparent paradox will work out, (probably very differently depending on location, skills, etc.), but it is kind of interesting and amusing at the same time.

    3. How you are thinking about and reacting to news of a good employee quitting is probably changing too. In 2008 or 2009, you might have reacted by thinking, 'What is she crazy? Where is she going to find another job with as good pay/benefits/cupcake Friday like we have here?'. Now? Probably you'd think more along the lines of 'Hmm... She's going to XYZ Corp? I wonder if she could bring me over there too.'

    4. Last, while the Quit rate increasing kind of feels like it is a good thing, there is certainly some warning signs as well. For one, those recent quitters might find that their skills and experience are not in as high a demand as they figured, and thus end up spiking the unemployment rate in the short term, (as well as having to take a boatload of grief from people questioning their sanity for quitting a perfectly good job). They might find, even today, that keeping a job is much easier than finding a job. And increasing worker confidence might put pressure on companies to increase wages, which can also have a detrimental effect on growth and profits.

    So take a look at the JOLTS report if you are interested in this kind of data, I think it gives a little more color and depth to the more widely reported headline of the total rate of unemployment.

    Are you seeing an increase in 'quits' in your shop?

    Ready to quit yourself?

    Have a great Wednesday!

    Monday
    Feb032014

    CHART OF THE DAY: Where the new jobs are projected to be

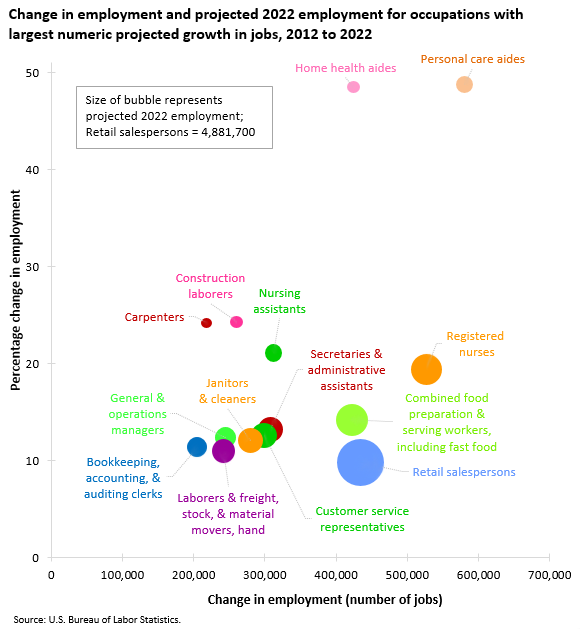
    Once again from our friends at the Bureau of Labor Statistics, today's chart is all about jobs - more specifically a look at in which occupations the BLS is forecasting the greatest numerical growth in jobs for the ten-year period of measurement, 2012 - 2022.

    Take a look at the chart, then (of course) a few comments from me afterward:

    Digging in to the data a little bit more (and taking into account the sheer difficultly in making these kind of far out into the future sorts of projections), reveals both some warnings, and some surprises.

    First off, something that is not surprising, is that of the 30 areas projected to experience the largest employment increases, 5 are in healthcare, including 3 of the top 4 jobs that are expected to see the greatest increase, (personal care aides, registered nurses, and home health aides).

    Combined, the top 5 healthcare related occupations are projected to add 1.6 million jobs over the 2012–2022 decade. 

    But while the growth in healthcare jobs is not surprising, given the pressures being put on the healthcare system due primarily to an aging population, what is surprising is what the BLS suggests about the educational attainment needed by workers desiring to actually work in these faster-growing occupations.

    From the BLS sumary:

    Two-thirds of the occupations projected to add the most new jobs typically require a high school diploma or less, while only five typically require a bachelor’s degree.

    Now that little observation is, to me at least, a little surprising, or perhaps just a little misaligned with everything that we typically see about the importance of higher education as it relates to a candidate's job prospects. But upon closer examination of the BLS job growth projections, perhaps we should not be that shocked at all. 

    The care aides kinds of jobs, the retail jobs, the food prep and serving jobs, the customer service reps, (all in the Top 10 list of 'growth' occupations), well none of these require (typically), much if any higher education and of course, also typically offer relatively lower wages than the kinds of jobs of the future we like to think about, (like coding apps, designing wearable computers, or working in high finance).

    Yep, according to the BLS anyway, job growth to 2022 is going to be mostly about low-skilled, low-wage, low prospects kinds of service jobs.

    Actually the easiest kinds of jobs for the robots to take.

    Happy Monday.

    Thursday
    Jan302014

    On positive reflection and workplace stress reduction

    Quick shot for a 'I have about 7,817 emails to read/reply to Thursday' but want to put off that torture for at least 15 more minutes, (the time allotted to research, write, edit, and hit 'Publish' on this sucker).

    Did you catch the HBR.org 'Daily Stat' item from this past Tuesday? If not, here it is in its entirety (please don't come after me Harvard):

    Stress levels and physical complaints declined by roughly 15% after employees were directed to spend 10 minutes writing about three things that had gone well each day, says a team of researchers led by Joyce E. Bono of the University of Florida. At the end of the work day, the employees logged on to a website where they were asked to write about events large or small, personal or work-related, and explain why they had gone well. The findings suggest that this intervention could have important effects on employee stress and health, the researchers say.

    SOURCE:  Building Positive Resources: Effects of Positive Events and Positive Reflection on Work Stress and Health.

    Pretty simple right?

    Take about 5-10 minutes at the end of the day and deliberately think about, and document, three positives from the day - work successes, some good news in your personal life, maybe even something simple like your favorite NBA team won the game last night. Do this every day and over time, at least according to this research, your overall stress level is likely to decline, and you will start to feel better overall.

    Sounds like it makes sense, lots of us forget to think about thepositives in our work or personal lives and focus on the negative. If you are encouraged/forced to write down or log in an online tool somewhere only the positive things at the end of the workday I suppose that will help you 'shut down' from work in a generally better mood and mental place than you might otherwise. Especially if the final 'work' of the day was something unpleasant or difficult or simply just a pain in the neck, (like the task of reading all your email that I am currently avoiding).

    What do you think, would this kind of intentional positive reflection make a difference in reducing your stress levels?

    For me, I am not so sure. Maybe it is the cynic/pessimist in me, but the second I sat down to document the three positive items for the day, I would naturally look to pair or balance them with three negatives.

    And then I'd probably be back to focusing on the negatives again and stressing and you know the rest.

    But what the heck, I might as well give it a shot:

    Three positives from yesterday:

    1. Scored two First Class upgrades on my flights home from IBM Connect

    2. My old reliable truck actually started after 4 days parked outside at the airport in mostly sub-zero temperatures

    3. I made it home in time to watch KD and LeBron go at it in one of the NBA's best match ups

    I guess all in all that makes for a good day.

    I will let you know tomorrow if I feel less stressed. I still have all that email to read though...

    Happy Thursday!

    Wednesday
    Jan152014

    CHART OF THE DAY: The Labor Force in 2022

    ...will be older, (relatively smaller), more non-white, and will certainly have more robot participation...

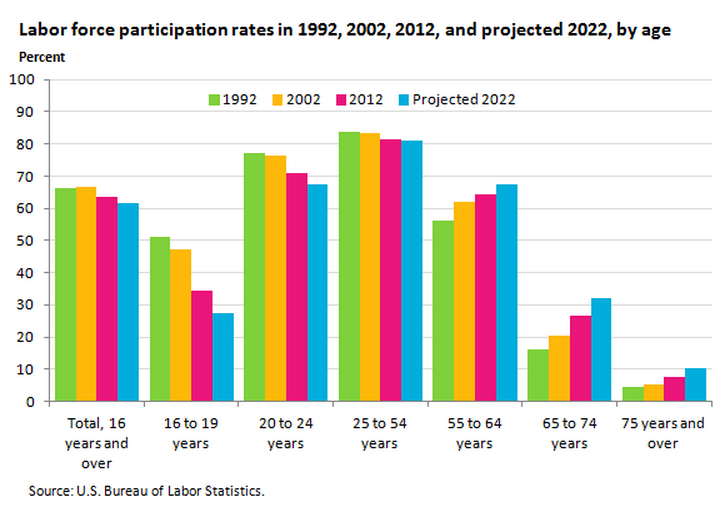
    First, here is the chart, courtesy of our friends at the Bureau of Labor Statistics:

    And below are the key findings from the aggregate data presented in the chart above, as well as in the details on gender, ethnicity, and sub-age group data (all found from the BLS in a piece titled "Labor force projections to 2022: the labor force participation rate continues to fall").

    The Bureau of Labor Statistics (BLS) projects that the next 10 years will bring about an aging labor force that is growing slowly, a declining overall labor force participation rate, and more diversity in the racial and ethnic composition of the labor force.

    The labor force participation rate increased in the 1970s, 1980s, and 1990s and reached an all-time high during the 1997–2000 period. The rate declined during and after the 2001 recession before stabilizing from 2004 to 2008. The labor force participation rate fell in 2009 and continued to fall after the 2007–2009 recession ended. As the baby-boom generation ages and begins to retire, BLS projects that the overall labor force participation rate will continue to decline to 2022.

    During the 2012–2022 period, the growth of the labor force is anticipated to be due entirely to population growth, as the overall labor force participation rate is expected to decrease from 63.7 percent in 2012 to 61.6 percent in 2022.

    There is lots more in the details from the BLS piece, but I think you get the gist. And if you have been following this trend for any amount of time, you are probably not really surprised by the data.

    What is surprising, at least to me, is that whenever a new monthly employment report is released by the DOL that the talking heads on the business news continue to lament the low (and declining) labor participation rates, and speculate on the reasons why and the potential policies that could reverse this trend.

    If these 2022 projections from the BLS are accurate, or even close, I wonder if it makes more sense to quit trying to bring back the days of 2000 or so, and instead focus on what a smaller, more diverse, and older labor force means to our organizations and our economy.

    No fiscal program is going to turn back the clock for all the aging boomers. And hardly any feasible rise in the minimum wage is going to convince more 16 - 24 year olds that they would be better off working more and going to school less.

    The only age groups where participation is increasing are 55+.

    Keep that in mind this year as you are working on your 5 - 10 year business plans.

    Happy Wednesday.