Quantcast
Subscribe!


Enter your email address:

Delivered by FeedBurner


E-mail Steve
This form does not yet contain any fields.

    free counters

    Twitter Feed

    Entries in ECON (17)

    Tuesday
    Nov072017

    CHART OF THE DAY: Reminding you that China is really, really big

    Regular readers of the blog will remember that I've been fortunate enough to be a part of the first two HR Technology - China Conferences in 2016 and earlier this year. Both times visiting China, learning more about the HR and the HR technology ecosystems there, and meeting some truly engaged HR leaders, I have left more and more impressed and in a way, awed by the size, scale, growth, and innovation of HR and HR tech in that country.

    I look forward to going back in 2018 for sure and in the meantime, I am a member, (the only non-Chinese member I think), of a 30-person strong group chat on WeChat titled 'AI in HR', where HR folks I met in China share information and discuss innovation in HR and HR tech. It is really cook, even if I can only successfully translate about half of it. Get on that, WeChat.

    So I'm a mark for interesting information and additional insight about China and when I saw the below chart/infographic, wanted to share on the blog as a reminder for those of us that sometimes forget, or just never think about, the scale and size (and opportunity), the growth opportunities for businesses of all kinds that China presents.

    So here's the chart, courtesy of Visual Capitalist, then a comment or two from me after the data. Email and RSS subscribers may need to click through to see the chart.

    Pretty amazing, right? That many 'mega-cities' that rival many medium to large countries in terms of the size of their economies.

    A couple of things struck me. One was kind of personal in that the first HR Tech China Conference was held in city called Zhuhai, which, (it seemed to us), was a really large, growing, busy, and important city in Southern China, strategically positioned between Kong Kong and Macau. That city, Zhuhai, does not even crack the Top 30 in terms of economy size in China. Amazing.

    And last, taking a closer look at the map in China, and thinking about these different cities and regions and how they are different, i.e. some still focusing on manufacturing while others are financial centers or hubs for innovative new tech (like AI), reminds me that it is really, really hard to get to 'know' China from just taking a few business trips or attending an event or two. Spending four days in Beijing and thinking you 'get' China would be like taking a long weekend in New York City and concluding that you 'get' America.

    Anyway, file today's post under my philosophy for the blog since 2008 - 'It's interesting to me, so I'm blogging about it'. Your mileage may vary.

    Happy Tuesday.

    Wednesday
    Apr122017

    It's better to have a job when you're looking for a job

    As the 2007-2008 financial crisis and subsequent economic recession fade further and further into the distance, we don't in 2017 talk about unemployment all that much. The sustained recovery in the labor market has pushed unemployment to near "full employment" levels of about 4.5% in the US, and in many sectors and job roles most employers would report 'good help is hard to find'. Until the robots take over. But that is a different story for another time.

    Back to unemployment though. In 2008 and 2009, there was plenty of discussion about the best ways to help the many, many folks who were out of work to get back into the labor force. Lots of job search gurus appeared online, plenty of networking and support groups were created, and certainly significant governmental support, (cars, banking, insurance), was marshalled to try and stop the bleeding in the labor markets and help get people back to work (or keep them in work).

    Around that time, as the unemployment rate topped at about 10%, one peculiar storyline emerged, and pretty consistently as well - namely that folks who were unemployed, and 'actively' looking for work, were often characterized as less desirable candidates than say someone who was currently employed, and may not even be actively looking for something new. The dream 'passive' candidate if you prefer that term. Lots of anecdotes about hiring managers passing on any candidate who was out of work were shared, and plenty of folks, (I possibly was one of them), opined about how unfair that this kind of (for lack of a better word) discrimination against the unemployed was seemingly more and more prevalent. And anecdotal or not, it certainly seemed that looking for a job when you did not have a job was much, much tougher than looking for one when you were already employed.

    But just how much tougher is it, really?

    A recent study by the Federal Reserve Bank of New York looks to put at least some data around these anecdotes by looking at job search activity by unemployed workers, by employed workers, (both passive and active), and people out of the workforce. The entire report is interesting and worth a read but I thought I would tease out two of the report's most interesting findings about job search, and more importantly, job search outcomes.

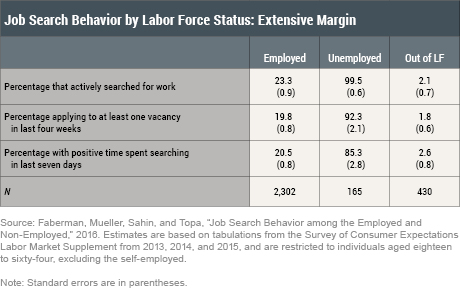
    1 - Lots of employed people are actively looking for work - almost one quarter of them 'actively' searched in the trailing four weeks of the survey period

    Not shocking I guess, but also the 23.3% doesn't account for the probably much larger number of employed workers that would be open to at least discussing new opportunities, even if they were not in active search. Said differently, one of the reasons contributing to a bias in favor of employed workers is the fact that just about all employed workers are still in the candidate pool anyway. At least partially in.

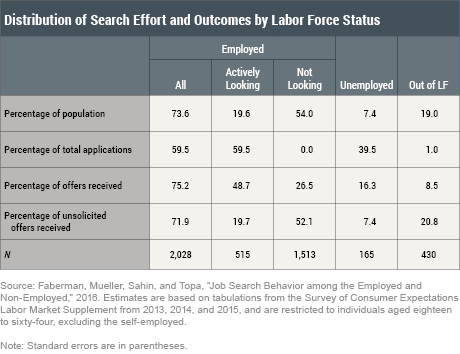
    So how does this perceived bias influence outcomes? Here's the money chart from the study, depicting how search behavior and application intensity translate into positive outcomes, i.e. job offers.

    I will help you with the fine print here. Unemployed workers make up about 7 percent of the survey sample. They send out 40 percent of the total job applications, but receive only about 16 percent of the total job offers.

    In contrast, folks who were employed and were actively looking for work make up about 20 percent of the sample but receive almost half of all offers. Further, the employed not looking for work (and who do not apply for any jobs), receive about one‑fourth of all the offers in our sample—more than the unemployed who are the most active searchers and applicants.

    So how much better is it to be employed when looking, (or in many cases not looking) for a new role?

    Well, according to this data, much, much better. Roughly it takes eight times the effort in terms of time spent and four times the application rate for unemployed folks to generate a similar rate of job offers that employed workers realize - many of whom are not looking for work at all.

    Hopefully we won't have another dramatic economic or market shifting incident like the financial crisis that drives up unemployment and will make these findings and their impacts top of mind again. But it is good food for thought for any of us who may not love the job we have now, and are looking for something better.

    We just might want to hold on to that crappy job as long as we can, because having it makes our odds of finding the next (hopefully less crappy) job that much better.

    Monday
    Mar202017

    CHART OF THE DAY: More on the increasing 'Quits' data

    Quick shot for a busy 'Can you believe my Gamecocks are in the Sweet 16?' kind of a Monday.

    Here's just one chart from the latest release of what regular readers recognize as my favorite labor marker report - the Job Openings and Labor Turnover Survey - aka the 'JOLTS' report. 

    This chart illustrates the amount of 'Quits'  better known in HR speak as Voluntary Separations, compared with the amount of Layoffs and Discharges, AKA, 'Pack your things, son, it's time for you to go' deals.

    Here's the latest chart of this data, then as we all have come to expect by now, some FREE comments from me:

    Three quick observations...

    1. Really interesting right now that these two lines continue to get farther apart, and the gap between Quits and Layoffs/Discharges continues to increase. The delta between the two series is now 1.6 million, with Quits hitting 3.2 million in January, against 'only' 1.6 million Layoffs/Discharges.

    2. The continuing increased in the level of Quits is generally seen as a proxy measure for the overall health of the labor market. The thinking goes that when employees feel more confident in their ability to find alternative work, (either at another company or for themselves), then they are more likely to 'quit' the job they have now. It is a seller's market for labor in some sense. 

    3. If this trend continues, and labor markets continue to tighten, (you can also look at total job openings to get a sense of this), then employers will (according to the immutable laws of supply and demand), be forced to take counter measures. They can either look to reduce 'quits' by raising wages, improving benefits, or striving to become less crappy places to work. Or, they can look to alternate sources of labor - offshoring, outsourcing, automating, etc., in order to find the talent/labor they need.

    The slow and steady economic recovery since the bottom of the last recession marches on. Unless something changes relatively soon, 2017 is shaping up to be a good year for folks who are in demand, have negotiating leverage, and are feeling as confident as ever in their ability to control their careers.

    Have a great week! 

    Go Gamecocks!

    Wednesday
    Feb012017

    CHART OF THE DAY: Piles and piles of cash

    Lots of noise and stress lately that comes from a political transition and in this case a transition to a philosophy that is a dramatic departure from at least the last eight years, (if not longer). I did my one and only (I promise) take on the most controversial happenings (so far), on Monday, but I wanted to hit one more quasi-political issue, but also one that impacts work, business, and potentially jobs.

    Namely, the staggering amounts of cash that many of the largest American firms are holding, and in particular, the increasing levels that these firms have 'parked' in overseas accounts (ostensibly to avoid paying US corporation income tax on the funds). 

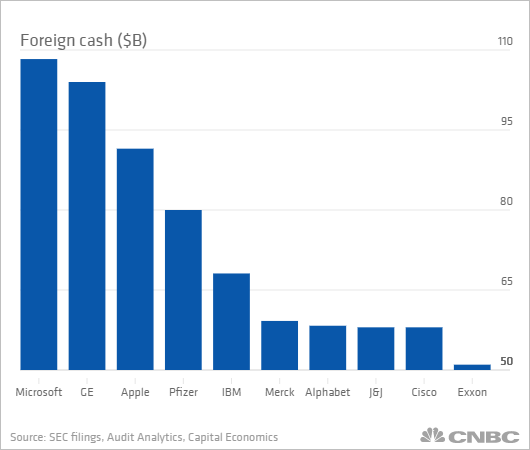
    Here's a reasonably recent chart (from last September) showing some of the larger companies and overseas cash piles, (courtesy of CNBC), then some comments for me after the data.

     Three quick takes on this stockpile of overseas cash (and large cash reserves by corporations in general)

    1. American companies are holding about $2.5 Trillion (that is with a 'T') in overseas cash, which is more that 10% of the US annual GDP. Tack on the close to $2.0 Trillion, (that is another 'T'), in cash that US companies are holding domestically, you have about $4.5T in cash that is essentially doing nothing to build business, increase investment, hire more people, etc. Lots and lots of arguments for why this is the case, (not all of them political in nature), but I think we all can agree that this tremendous cash hoard represents untapped potential for growth.

    2. The main reason that American companies cite for parking so much cash overseas is the relatively high US corporate tax rate of 35%. It is by most analyses the highest corporate rate among developed economies. So when you combine a high tax rate, an additional surplus of domestic cash for many large companies, and still low by historical standards borrowing costs, many of the largest US companies are content to sit and wait and stare at their cash piles.

    3. Finally, many economists predict that a lowering of tax rates and a surge in repatriation of corporations overseas cash probably would not spur the kind of economic stimulus that many expect. Many of these firms would use substantial portions of this cash on stock buyback programs and increases in their dividend rate. These actions primarily benefit shareholders rather than the broader economy. Besides, some argue, if these companies had better ideas to invest this cash (new facilities, R&D, hiring more people, etc.), they would just do that.

    Sure, I know that most organizations, particularly smaller ones, would love to have the problem of not being able to figure out what to do with all their excess cash laying around. But all this cash is certainly not a great sign for longer term economic growth, increased innovation, and enhanced employment opportunities.

    It is going to be interesting, if a little wonky, to keep an eye on corporate tax rates, repatriation deals, and just what ends up happening to these Trillions in the next few years. I suspect that whatever happens, it will have a pretty significant impact on US GDP, growth, employment, and more.

    Happy February.

    Tuesday
    Jul212015

    CHART OF THE DAY: Competition is global - at least one-third of it is

    Today's installment of the Chart of the Day series I think represents perfectly why I like to run these posts - it actually uses hard data to reveal the reality about a topic about which it can be really easy to sort of just accept without much research or questioning. 

    Quick - before looking at the data, try to take a stab at answering this question: In the modern, connected, networked, and global economy, about what percentage of revenues of large US-based companies (represented for the sake of argument by the members of the S&P 500), are earned from outside the USA?

    About half? Maybe more? I'm not sure, but I bet it is a lot?

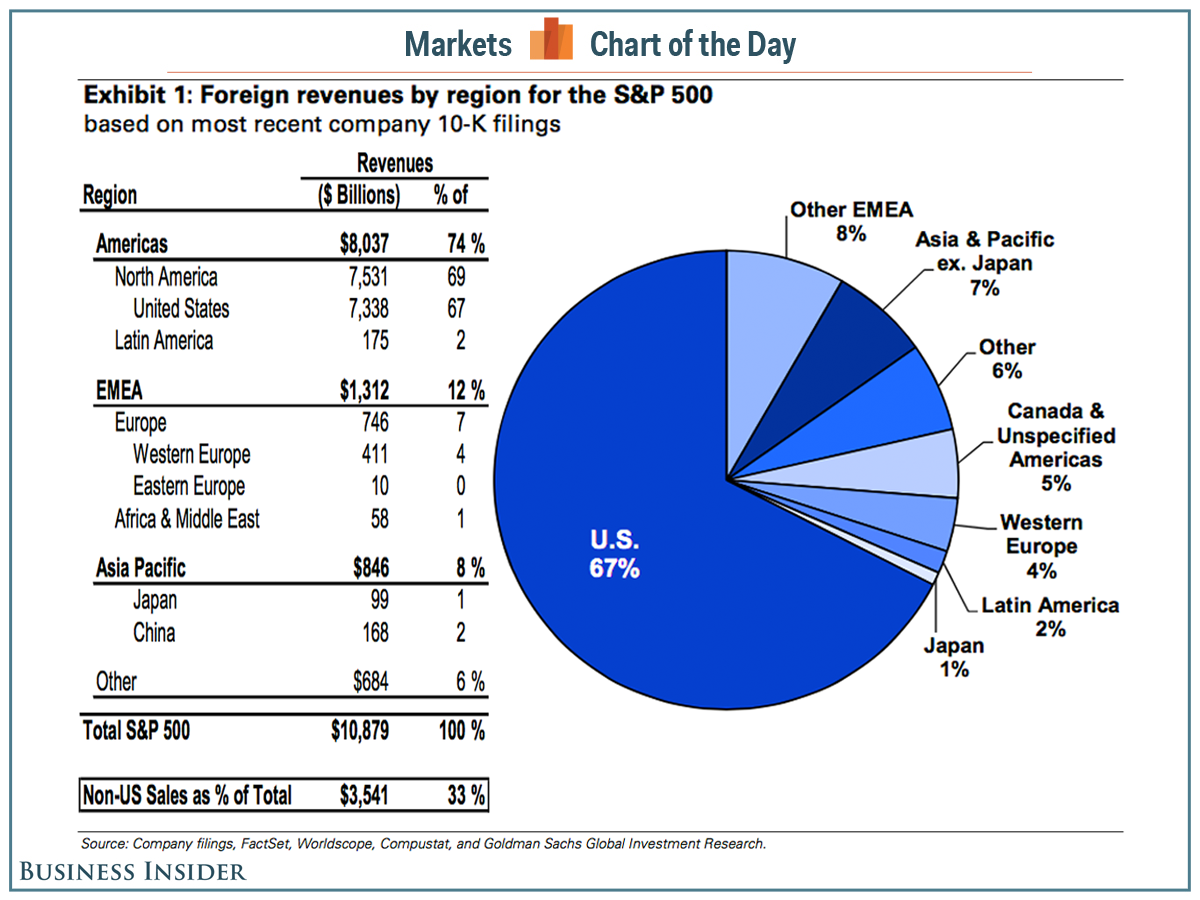
    Let's look at the data, then a couple of quick, FREE observations from your pal. That is me.

    Some quick takes:

    1. It may be a little hard to read, so I will break out the important numbers. Total revenues earned outside the US by the members of the S&P 500 companies is about 33%, with the largest share of non-US revenues coming from EMEA, (12%), and APAC, (8%). I am not sure about you, but when I saw this data, I was really, really surprised still in 2015 how much domestic revenues dominate the mix in America's largest companies. I mean I feel like we have been hearing FOREVER how all competition is now global, and that in order to grow most companies have to look outside the USA. So while I do think that is still true, I was surprised by the extent to which neither of those things are really happening in a significant way.

    2. Having said that, your organization's best opportunities for growth may still be in the USA. If nothing else, these statistics reveal still how hard it is for US-based companies to compete in foreign markets. At least 25 years of attention to places like Asia and Europe still have not generated much more than about 10% of the S&P 500 companies revenues, respectively. If you are a smaller company, perhaps you should still keep your primary and secondary growth strategies focused on the domestic market, even if you feel like it is a tapped out. Upselling, expanding your target customer size, making adjacent market moves are all much, much easier on familiar territory than they are in one of the hundreds of places in the world who have no idea who you are.

    3.  It is more important to have diversified customers, no matter where they are, than customers all over the world. Reducing your organization's reliance on one market, even one the size of the USA, sounds like a smart strategy. But if the reality of the difficulty in cracking markets overseas makes the 'global' strategy too hard to execute, then domestic diversification is the next best, (maybe even the best) thing. It is more important to make sure that one or two massive customers don't represent half of your revenues than it is to worry that 96% of your total revenues come from inside the USA. 

    So that's my take, I found this data really interesting and surprising too. Would love to hear if you felt the same.

    Have a great Tuesday!