CHART OF THE DAY: The World Economy in 2030
 Steve
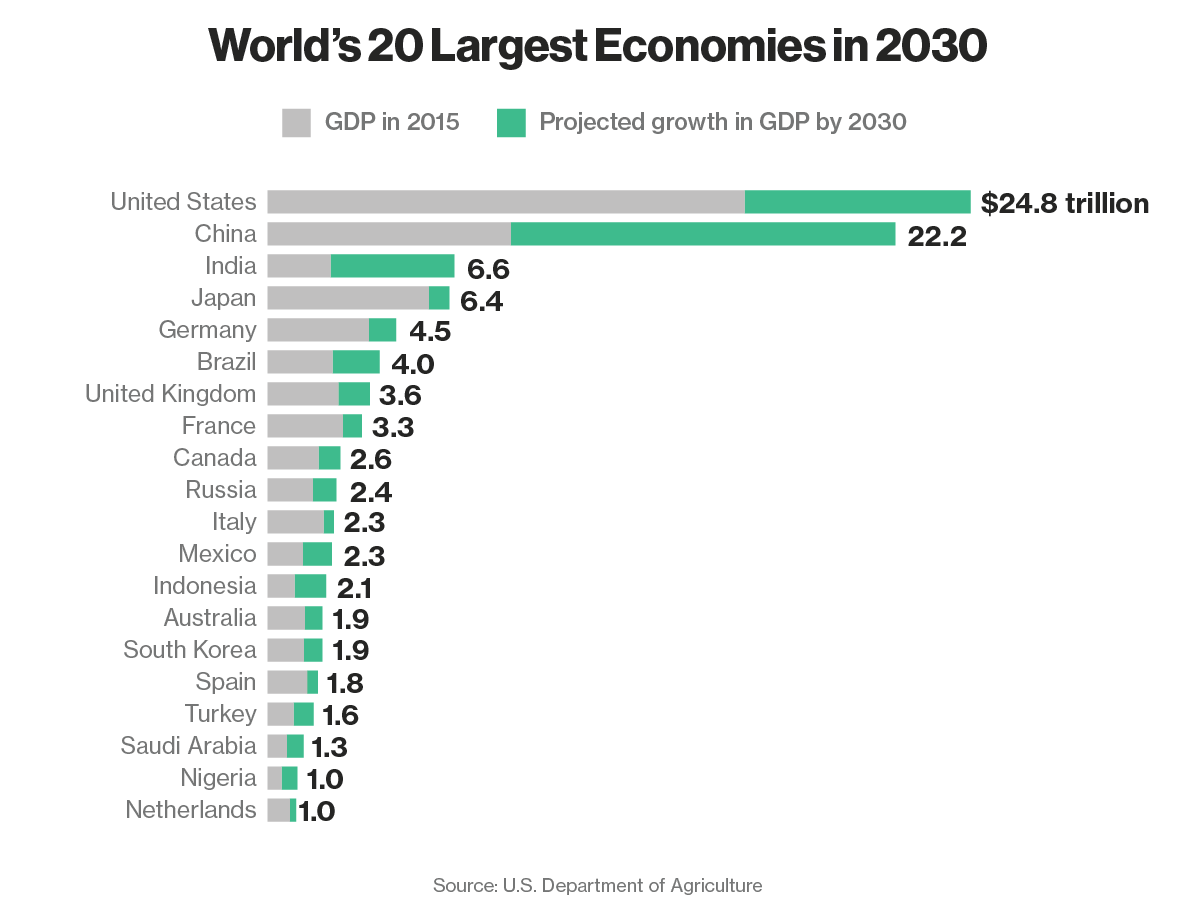
SteveToday's Chart of the Day comes to us courtesy of Bloomberg - a look at the World's 20 largest economies by GDP, stacked up and showing both their relative sizes today, and the estimates for where the Top 20 will rank by 2030 - just 15 years from now.
As always, we will hit you with the chart, then some FREE commentary from me (it is my blog) after the data:
So for the HR/Talent pro what is there to make from the data on the World's largest economies in 2030?
Three things come to mind:
1. Look around. If you and your organization is US-based, or derives its sales and income primarily from US customers, you probably have a few years, maybe as many as 10, before you need to really worry about how these shifts in size and scale might impact your business and livelihood. You might be ok for a while, maybe for a long while, but if double-digit growth in sales and income in on your organization's 5-year plan, then it is going to be really challenging to achieve that target unless you start (or increase) the business you are doing in the faster-growing countries of the world.
2. China. Of the Top 20 economies China is expected to grow the most in the next 15 years, coming really, really close to topping the US as the world's largest. What are you doing today to help your organization better prepare to compete for your piece of this huge and growing market? Do you have the right kind of talent that can work in and understand this market? Are you able to talk confidently about the unique HR/Talent challenges you'd face, both with managing expats as well as recruiting locally?
3. Slow growth in the old world. Places like Germany, France, Italy - heck, pretty much all of Europe are predicted to grow much slower, and thus make up a smaller portion of the world economy, over the next 15 years, than emerging powers like India, China, and Brazil. This is not really news, but again for the most part in the US we still tend to think of Europe and European countries as having much more influence in the global economy than perhaps we should.
No HR pro lives in a vacuum. No organization operates completely immune to the larger market forces that surround us all. It's important to know where the future might take us, and perhaps even more important to know how to speak the local language when we get there.
Have a great weekend!