

CHART OF THE DAY: How America will look in 2050 in one chart
 Steve
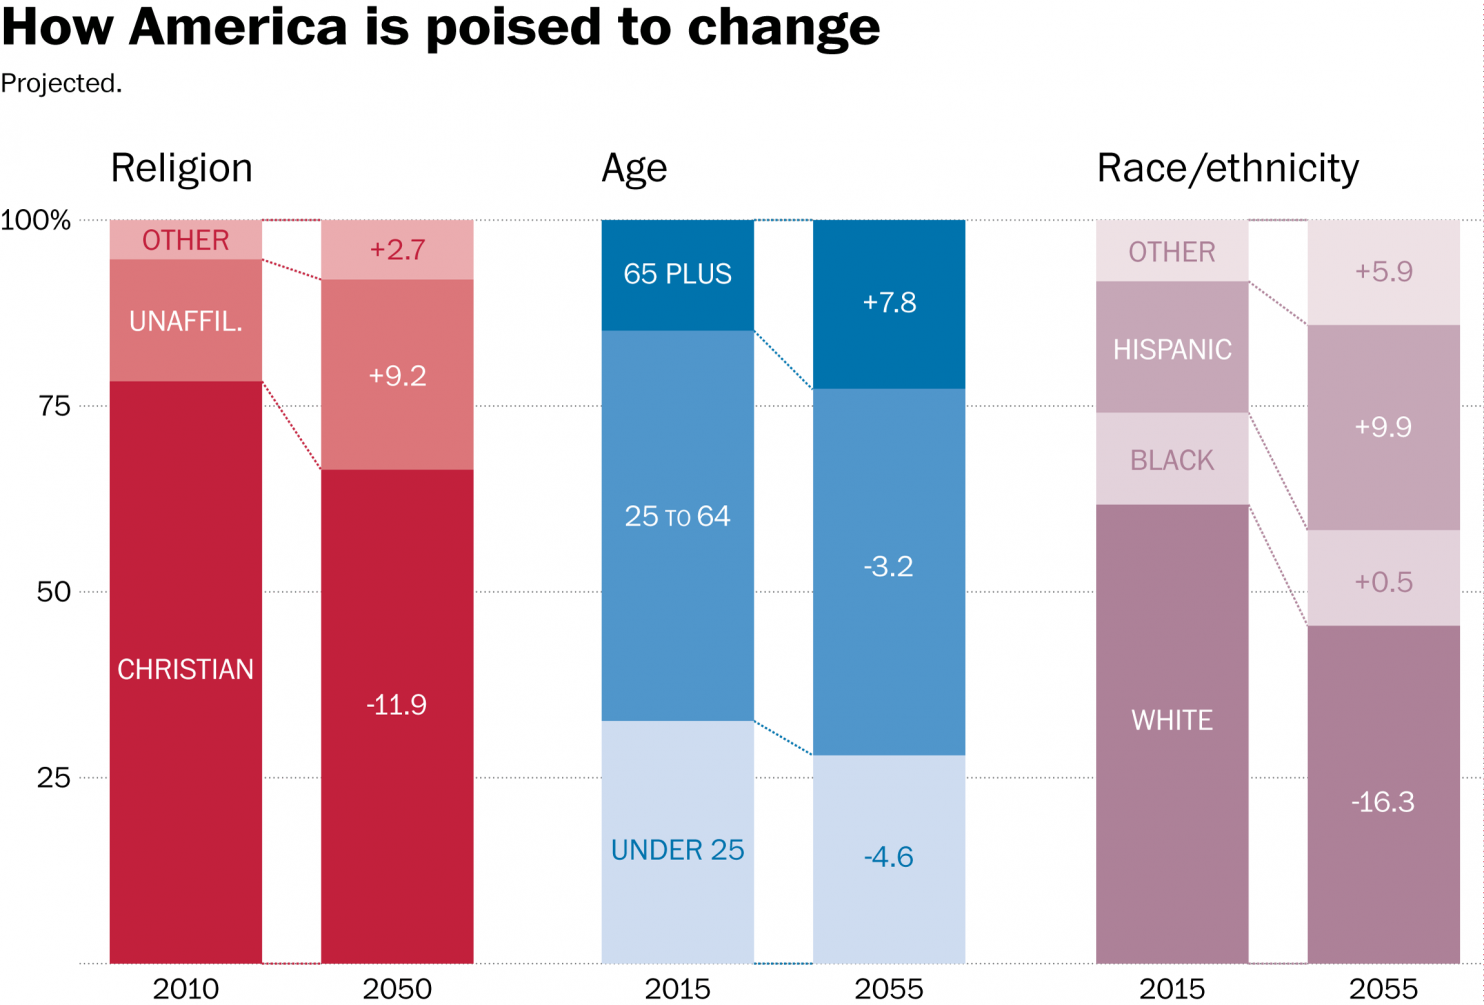
SteveThis short, but fascinating recent piece from the Washington Post is the source for today's installment of CHART OF THE DAY - a quick snapshot of how the US population is expected to change by 2050 in three key areas - religious affiliation, age, and race/ethnicity. As always, I will drop in the chart, then some FREE commentary from me after the data:
 Washington Post
Let's take a shot at interpreting the meaning/relevance to HR/Talent pros of each of chart's three data sets in order, shall we? Sure why not...
1. Religious affiliation - A big trend here is the increase in the percentage of the population that will categorize their religious affiliation as 'unaffilitated', i.e., not attached to a specific or traditional religion or church. Folks who consider themselves 'spiritual' but not formal church members fall into this group. What might be the HR/Workplace implication of this trend? Kind of hard to say. Could be that more organizations over time will have to re-think their company holiday schedules and practices as fewer employees will identify with the religious-oriented holidays. Probably of the three data sets in the chart this one is the toughest to interpret.
2. Age - This data is not surprising to anyone who watches demographic trends - a big surge in the population of older Americans, so much that the 65+ cohort will be almost the largest in the country by 2050. Of course living longer in general, means working longer into older age as well. Workplaces in the next few decades are going to have to do more to accommodate this rise in older workers through some combination of physical and environmental changes along with support and benefit programs more tailored an older workforce.
3. Race/Ethnicity - Again, nothing really surprising in this data, America in 2050 will be less white, more Hispanic, and generally much more diverse overall. This trends has been playing out for a while, but slowly, so perhaps most HR pros are not yet doing or at least thinking differently about what it might mean for work and workplaces. At a minimum any organization that is conscious about wanting their workforces (and more importantly perhaps, its leadership ranks), reflect more closely their customers and communities are going to start to feel the pressure soon. It will be kind of a shame if by 2050 if most of the white guys we see in the workplace have C-level titles.
Anyway, that's it from me. Share your thoughts in the comments on this data, if it matters at all to you as an HR pro, and what you and your organization might do in response.

Reader Comments (1)
Steve, what do you conclude when you look at these 3 together? The data may tend to get "marginalized" when we just say each of these may cause us to respond in a particular way.