Quantcast
Subscribe!


Enter your email address:

Delivered by FeedBurner


E-mail Steve
  • Contact Me

    This form will allow you to send a secure email to Steve
  • Your Name *
  • Your Email *
  • Subject *
  • Message *

free counters

Twitter Feed

Entries in ECON 101 (12)

Wednesday
Feb262014

CHART OF THE DAY: The Return of the Quit

Since many of us in the USA have been a little preoccupied with the relentlessness of global warming that has cleverly disguised itself in the form of the coldest, snowiest, most miserable winter ever, you'd be excused if you didn't notice a little phenomenon or trend developing in your workforce reports and analyses.

Employees are quitting again. 

Well, to be fair, employees always quit, even in bad economic times. But take a look at today's Chart of the Day, from the Bureau of Labor Statistics year-end JOLTS (Job Openings and Labor Turnover Survey) report which suggests that the 'quit rate', i.e. the voluntary separations as your HRIS probably calls them, is trending higher and higher.

Here's the chart, and then (of course), some FREE commentary from me:

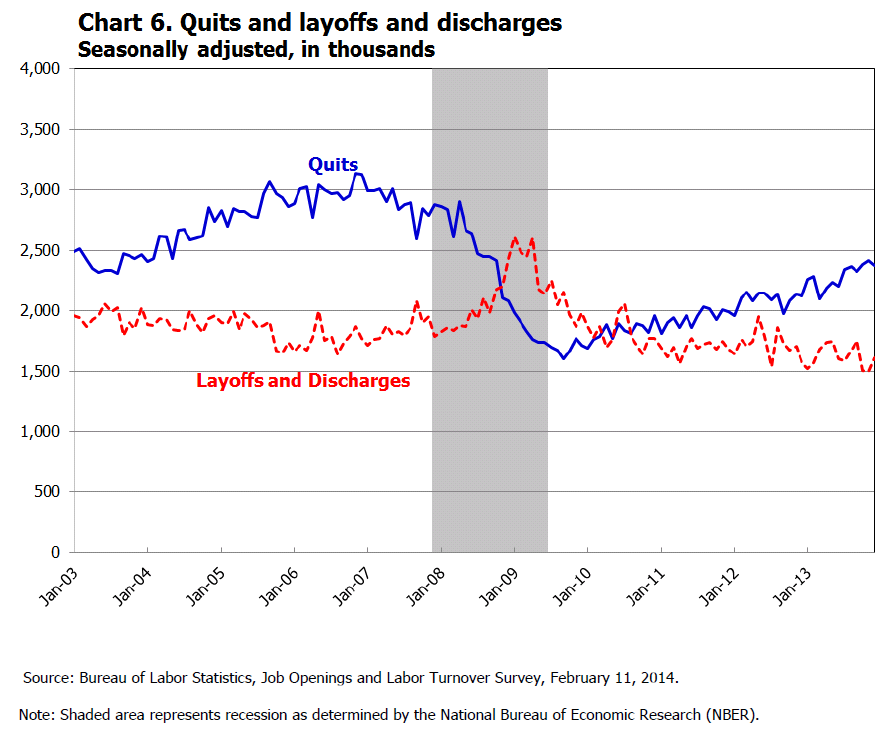
Source - BLS Jolts report Dec 2013

Some thoughts:

1. 'Quits' are a function of several factors, (personal circumstances, the magnitude of the jerkitude of your managers, people self-selecting out as not being in the right job, etc.), but most observers of the Quit rate on a macro level ascribe movements in the rate to worker's confidence in their ability to find another, and what they think will be a likely 'better', job.  The rate moving up, to a level that is approaching the pre-recession level, is a signal that overall job market confidence is rising.

2. So while you and many other HR/Talent pros are lamenting about 'hard-to-fill' jobs, simultaneously more of the workforce are thinking of themselves as 'easy-to-place'. I'm not sure how that apparent paradox will work out, (probably very differently depending on location, skills, etc.), but it is kind of interesting and amusing at the same time.

3. How you are thinking about and reacting to news of a good employee quitting is probably changing too. In 2008 or 2009, you might have reacted by thinking, 'What is she crazy? Where is she going to find another job with as good pay/benefits/cupcake Friday like we have here?'. Now? Probably you'd think more along the lines of 'Hmm... She's going to XYZ Corp? I wonder if she could bring me over there too.'

4. Last, while the Quit rate increasing kind of feels like it is a good thing, there is certainly some warning signs as well. For one, those recent quitters might find that their skills and experience are not in as high a demand as they figured, and thus end up spiking the unemployment rate in the short term, (as well as having to take a boatload of grief from people questioning their sanity for quitting a perfectly good job). They might find, even today, that keeping a job is much easier than finding a job. And increasing worker confidence might put pressure on companies to increase wages, which can also have a detrimental effect on growth and profits.

So take a look at the JOLTS report if you are interested in this kind of data, I think it gives a little more color and depth to the more widely reported headline of the total rate of unemployment.

Are you seeing an increase in 'quits' in your shop?

Ready to quit yourself?

Have a great Wednesday!

Wednesday
Feb192014

An aging workforce case study: When clowning isn't cool anymore

I've posted a few times over the last year or so on the blog about the really interesting and important demographic changes happening in the American workforce. Mostly, these changes break down into two, related areas. One, the workforce and the population overall is aging. And two, the overall US labor force participation rate is falling, due in large part to the increasing number and pace of retirements of baby boom generation workers.

But those posts of mine I've linked to above, and honestly most of the 'Econ' type articles on these trends (and their implications for workplaces, companies, and policy), tend to be pretty dry and mostly academic and not really the kinds of pieces that really make anyone think for more than a minute or two about them. Bar charts with fancy shading or graphs with some trend lines can only move you so much. None of seems all that real if you get my meaning.

So for this re-set and take on the aging workforce and what it might mean for you, instead of dropping another chart and trying to convince you that this stuff matters, I want to point you to a short, but fascinating piece from the NY Daily News titled National Clown Shortage May Be Approaching, Trade Organizations Fear that illustrates just how these trends are playing out in the real world, (if 'clowning' could be considered the real world that is).

Turns out there aren't enough people, especially younger people, taking up professional clowning as an occupation. Check some quotes from the NYDN piece:

Membership at the country’s largest trade organizations for the jokesters has plunged over the past decade as declining interest, old age and higher standards among employers align against Krusty, Bozo and their crimson-nosed colleagues.

“What’s happening is attrition,” said Clowns of America International President Glen Kohlberger, who added that membership at the Florida-based organization has plummeted since 2006. “The older clowns are passing away.”

“The challenge is getting younger people involved in clowning,” said Association President Deanna (Dee Dee) Hartmier, who said most of her members are over 40.

“What happens is they go on to high school and college and clowning isn’t cool anymore,” he said. “Clowning is then put on the back burner until their late 40s and early 50s.”

Right there, in the micro-micro world of professional clowning you can see just about all of the major issues with much wider swaths of the workplace and jobs landscape today.

The job has been around a long time, but kids don't see it as cool anymore, and not enough of them are entering the field.

The incumbents are all getting older, retiring, even dying off and shortages are manifesting.

But the job, believe it or not, has higher standards for entry than in the past, so at the same time that interest in the field is falling, the barriers to entry are rising. And customers, the end customers I mean, are demanding more and more for thieir dollar. According to Ringling Bros. Director of Talent David Kiser, “Our audience expects to be wowed. No longer is it good enough to just drop your pants and focus on boxer shorts.”

Ok, at this point, if you have not already bailed out, I want you to think past the scary clown shortage, and consider the roles and people in your organization.

There is almost no doubt you have some of these kinds of 'clown' roles in your shop - ones that are important to the business, but for some reason do not attract enough of a pipeline or candidate flow to sustain once the incumbents trail off. But at the same time as these jobs get more important and pressing to fill, business or technology changes make the qualifications you are looking for even more difficult. Finally, these are still 'clown' jobs after all, they are not the best paying, most socially desirable kinds of gigs.

Oh, one last thing - in the 'If my suitcase doesn't show up in baggage claim within 5 minutes of touching down I am going to tweet about how terrible this airline is' age of the social media enabled customer, the demands for service and performance of this clown role (that you can't fill) are just getting worse.

Maybe not today, maybe not tomorrow, but soon I think, you will have to face the same kinds of challenges that are facing the circuses. 

What are you going to do to prepare for when (Insert whatever it is your company does) isn't cool anymore?

Monday
Feb032014

CHART OF THE DAY: Where the new jobs are projected to be

Once again from our friends at the Bureau of Labor Statistics, today's chart is all about jobs - more specifically a look at in which occupations the BLS is forecasting the greatest numerical growth in jobs for the ten-year period of measurement, 2012 - 2022.

Take a look at the chart, then (of course) a few comments from me afterward:

Digging in to the data a little bit more (and taking into account the sheer difficultly in making these kind of far out into the future sorts of projections), reveals both some warnings, and some surprises.

First off, something that is not surprising, is that of the 30 areas projected to experience the largest employment increases, 5 are in healthcare, including 3 of the top 4 jobs that are expected to see the greatest increase, (personal care aides, registered nurses, and home health aides).

Combined, the top 5 healthcare related occupations are projected to add 1.6 million jobs over the 2012–2022 decade. 

But while the growth in healthcare jobs is not surprising, given the pressures being put on the healthcare system due primarily to an aging population, what is surprising is what the BLS suggests about the educational attainment needed by workers desiring to actually work in these faster-growing occupations.

From the BLS sumary:

Two-thirds of the occupations projected to add the most new jobs typically require a high school diploma or less, while only five typically require a bachelor’s degree.

Now that little observation is, to me at least, a little surprising, or perhaps just a little misaligned with everything that we typically see about the importance of higher education as it relates to a candidate's job prospects. But upon closer examination of the BLS job growth projections, perhaps we should not be that shocked at all. 

The care aides kinds of jobs, the retail jobs, the food prep and serving jobs, the customer service reps, (all in the Top 10 list of 'growth' occupations), well none of these require (typically), much if any higher education and of course, also typically offer relatively lower wages than the kinds of jobs of the future we like to think about, (like coding apps, designing wearable computers, or working in high finance).

Yep, according to the BLS anyway, job growth to 2022 is going to be mostly about low-skilled, low-wage, low prospects kinds of service jobs.

Actually the easiest kinds of jobs for the robots to take.

Happy Monday.

Wednesday
Jan152014

CHART OF THE DAY: The Labor Force in 2022

...will be older, (relatively smaller), more non-white, and will certainly have more robot participation...

First, here is the chart, courtesy of our friends at the Bureau of Labor Statistics:

And below are the key findings from the aggregate data presented in the chart above, as well as in the details on gender, ethnicity, and sub-age group data (all found from the BLS in a piece titled "Labor force projections to 2022: the labor force participation rate continues to fall").

The Bureau of Labor Statistics (BLS) projects that the next 10 years will bring about an aging labor force that is growing slowly, a declining overall labor force participation rate, and more diversity in the racial and ethnic composition of the labor force.

The labor force participation rate increased in the 1970s, 1980s, and 1990s and reached an all-time high during the 1997–2000 period. The rate declined during and after the 2001 recession before stabilizing from 2004 to 2008. The labor force participation rate fell in 2009 and continued to fall after the 2007–2009 recession ended. As the baby-boom generation ages and begins to retire, BLS projects that the overall labor force participation rate will continue to decline to 2022.

During the 2012–2022 period, the growth of the labor force is anticipated to be due entirely to population growth, as the overall labor force participation rate is expected to decrease from 63.7 percent in 2012 to 61.6 percent in 2022.

There is lots more in the details from the BLS piece, but I think you get the gist. And if you have been following this trend for any amount of time, you are probably not really surprised by the data.

What is surprising, at least to me, is that whenever a new monthly employment report is released by the DOL that the talking heads on the business news continue to lament the low (and declining) labor participation rates, and speculate on the reasons why and the potential policies that could reverse this trend.

If these 2022 projections from the BLS are accurate, or even close, I wonder if it makes more sense to quit trying to bring back the days of 2000 or so, and instead focus on what a smaller, more diverse, and older labor force means to our organizations and our economy.

No fiscal program is going to turn back the clock for all the aging boomers. And hardly any feasible rise in the minimum wage is going to convince more 16 - 24 year olds that they would be better off working more and going to school less.

The only age groups where participation is increasing are 55+.

Keep that in mind this year as you are working on your 5 - 10 year business plans.

Happy Wednesday.

Wednesday
Dec182013

Uber, surge pricing, and data at work (at work)

The on-demand black car service Uber took quite a bit of flack over the weekend for implementing what is known as 'surge pricing' during a pretty nasty snowstorm in New York City. If you are not familiar with Uber, (and you should be because it really is an amazing service), the basics are pretty simple. Users use a smartphone app to summon a black car or equivalent that picks them up and then are taken to their desired destination. The entire payment transaction (including leaving the driver a star rating) is executed via the app, for prices (at least in my experience) ranging 15-20% more expensive than 'regular' taxi service.

But during times of extremely high demand for rides and low supply of on the road drivers (like on a Saturday night in a bad storm), Uber implements 'surge pricing', essentially increasing the cost of rides anywhere from 2 to even 6 or 7 times the normal fares in order to balance demand with supply. The ECON 101 logic is pretty simple - the increased prices (which users are warned about in advance of booking a ride) will serve to simultaneously reduce demand while increasing supply, as more drivers will be enticed to get out on the road in order to earn increased fees during the surge pricing period.

In addition to using basic pricing flexibility to manage and try and balance supply and demand, Uber also is attempting to mitigate the one really frustrating piece of the typical customer's experience, (I can attest to this one), which is the simple lack of availability of a car when you need/want one.

But the backlash from last weekend's surge pricing in NYC seemed pretty harsh as people took to Twitter to vent about their frustration with Uber for radically increasing their prices during a time of "crisis" in the city - it seems like there were scads of celebrities that were particularly peeved about having to pay what they felt like were exorbitant prices for transportation around town.

Putting aside the natural lack of sympathy I have for anyone complaining that their on-demand, door-to-door, black car service costs too much (on a Saturday night in the busiest city in America and during a snowstorm), I wanted to highlight this story as one of the very few that we see that showcases how data, technology, and the combination of the two are actually conspiring to benefit the front-line worker - in this case the Uber affiliated black car drivers.

Normal taxi drivers or even limo drivers might see a little extra in their pay rates for working a Saturday night, but certainly could not take advantage of the dramatic increase in demand for their services as the Uber drivers who braved the storm were able to realize.

Through a combination of new technology, absence of the pricing regulations imposed on traditional taxi services, more flexible labor rules, and most importantly, the presence of information of the increased demand, these Uber drivers were able to make better and hopefully, more informed, data-driven decisions about whether, where, and when to provide their services.

Most front-line workers never really get the exercise the kind of labor pricing power that we see in this example. Last Saturday night lots and lots of pretty well-off people wanted black car service on one of the worst weather nights of the year. The kind of night that most folks would rather stay home and stay warm, much less venture out into the cold and wet and storm to work for their normal pay.

Thanks to data and technology at least in this example, the Uber drivers who did venture out into the weather did a little better than most front-line workers.

It looks like they were paid what they deserved. Which is not always easy to say, both for black car drivers and for the celebrities they ferried up and down Manhattan last Saturday night.