Quantcast
Subscribe!


Enter your email address:

Delivered by FeedBurner


E-mail Steve
This form does not yet contain any fields.

    free counters

    Twitter Feed

    Entries in chart (85)

    Tuesday
    Nov182014

    CHART OF THE DAY: Unemployed vs. Job Openings by Industry

    Today's Chart of the Day comes to us courtesy of the Economic Policy Institute from a short post titled The Number of Unemployed Exceeds the Number of Available Jobs Across All Sectors.

    First the eponymous chart, then as you have come to expect (and demand), some comments from me after the data.

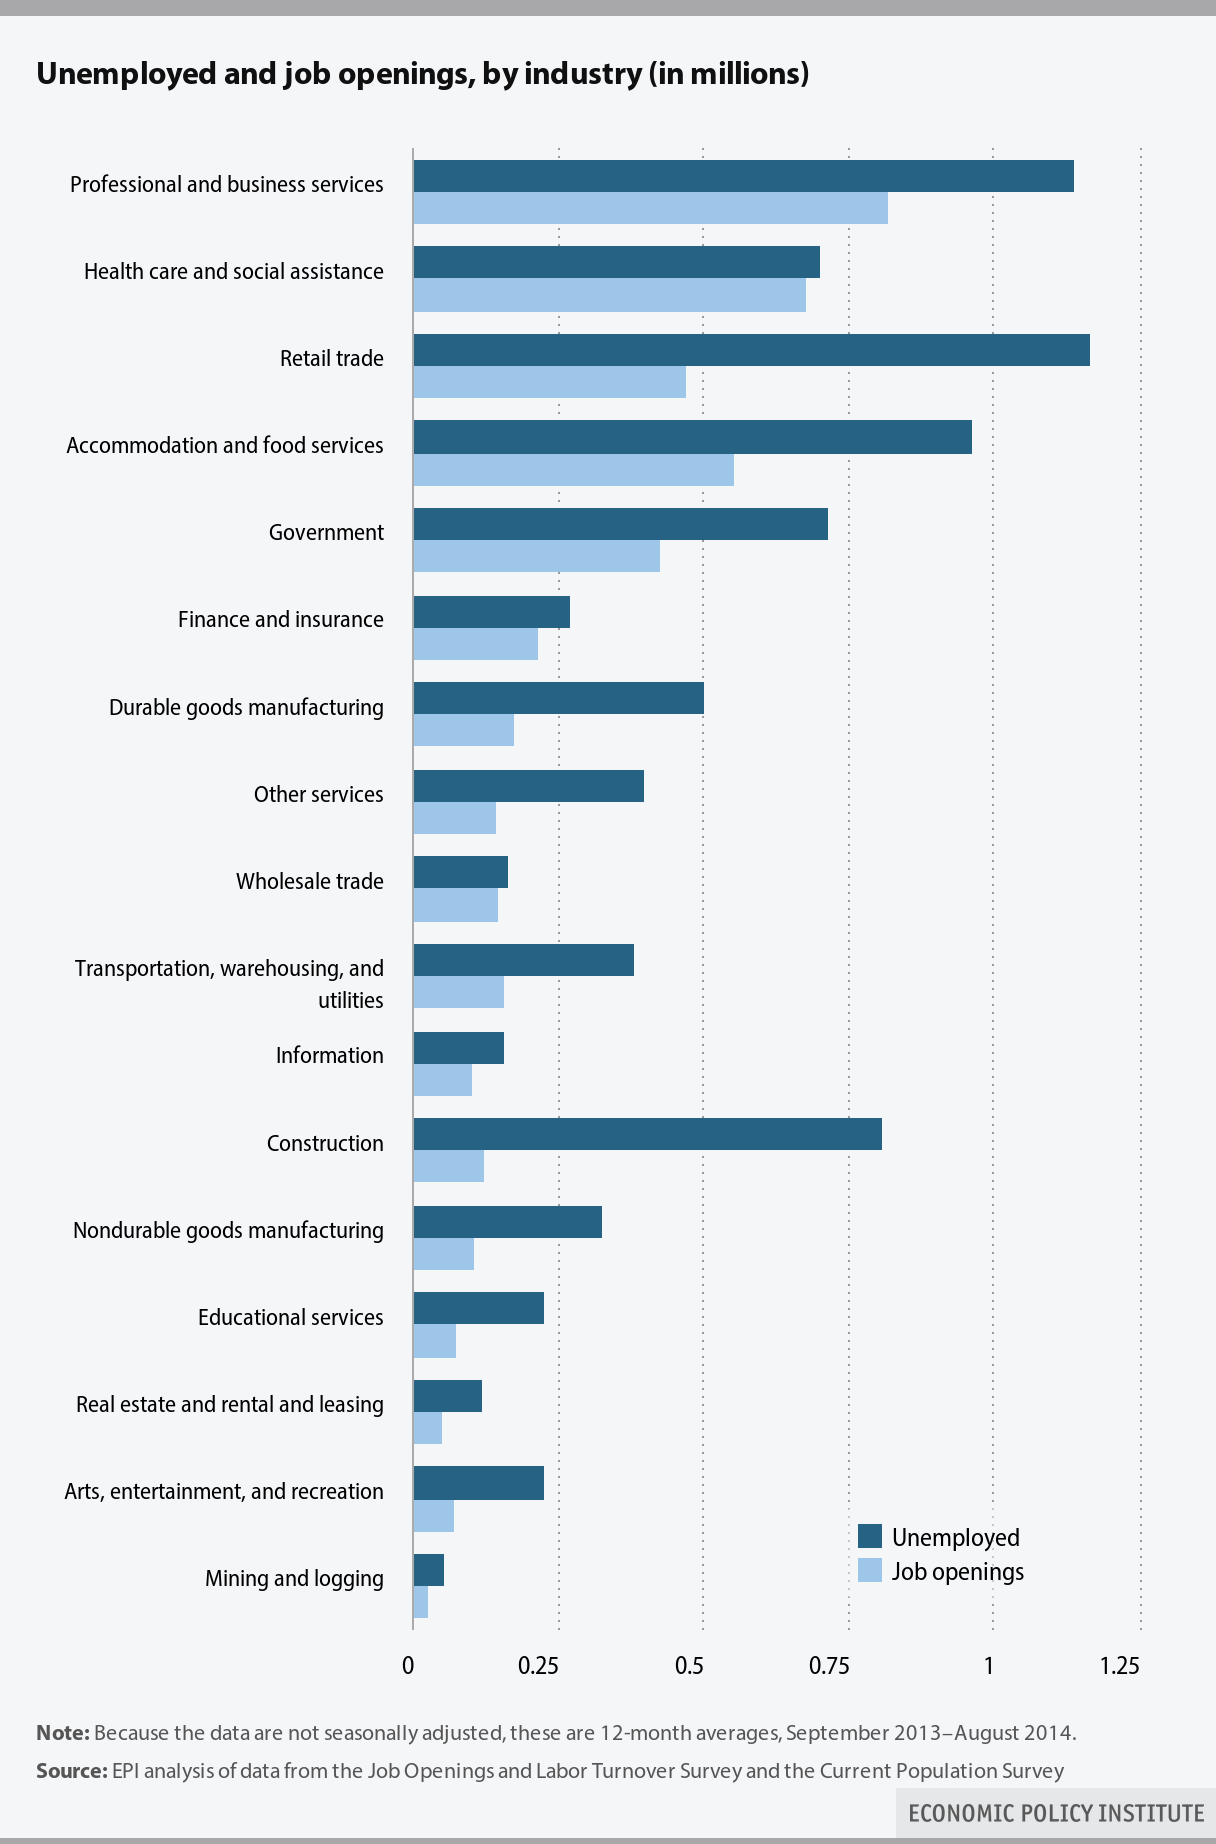
    The EPI piece's author uses this data to make an argument that persistently elevated levels of unemployment, that often are, (at least to some extent), attributed to something called 'skills mismatches', where unemployed workers simply do not possess the requisite skills and abilities that employers demand, are in fact not caused by mismatches, and are in fact driven by depressed overall demand for labor.

    The logic behind this argument is pretty straightforward. If there were indeed large levels of skills mismatches driving unemployment, then we should see, at least somewhere in the economy, particular industry sectors where demand (available jobs), surpasses supply, (available workers in that industry). But as the data above show, every industry sector currently has more supply (unemployed workers), than demand/jobs.

    It is a decent argument, if a little simplistic. It does fail to take into account the many thousands of sub-industries and specific types of jobs that fall into broad categories like manufacturing, construction, or services. It also does not adequately account for the very high likelihood that in certain sectors that workers who have identified themselves as being in that sector, truly have not been willing or able, (possibly because they have been out of work), do keep their skills current and adapted to new demands.

    But taken in aggregate there is a decent argument to be made that if current labor market challenges were the result of skills shortages or mismatches, that there would be at least some specific sectors where there are more unemployed workers than job openings, and others where there are more job openings than unemployed workers. But that is, as yet, not the case and still unemployed workers exceed jobs openings across the board.

    Whether or not there exists widespread skills shortages or mismatches is usually more of a concern for governments or the largest employers. And the nationwide conditions don't really mean much to the small or mid-sized firm that just wants to get its positions filled. But while all HR/Recruiting is local, (to some extent), no firm no matter how small operates in a vacuum. 

    So while these macro-labor market conditions might not move the needle on today's open reqs, they can and likely will impact tomorrow's and next year's and the one after that.

    And that is why I find this data interesting and why it rates for this installment of Chart of the Day.

    Thursday
    Oct232014

    CHART OF THE DAY: Everything you want to know about Labor Force Participation

    I know that I definitely have hit Labor Force Participation a few times in the past in the often imitated but never exceeded CHART OF THE DAY series here on the blog, but now thanks to some really excellent work out of the Federal Reserve Bank of Atlanta I think we have the best source yet for digging into Labor Force Participation.

    From the Fed Atlanta's Labor Force Participation Dynamics micro-site, check out just a couple of examples of what the data shows with respect to Labor Force Participation, that encompasses some important measures of who is actually working, looking for work, or unable to find work from the labor force.

    Chart 1 - The Big Picture - By mid-2014 Labor Force Participation was at its lowest rate since 1978

    Chart 2 - What accounts for this steep decline since the start of the financial crisis and ensuing recession in about 2007? Well, lot's of things, but mostly it is just the population getting older.

    Chart 3 - But what about people in their 'prime' working years? Are they still in the Labor Force in the same proportions history would suggest? Turns out not really.

    Chart 4 - But most of the decline in Participation for 'prime' workers has to be the bad economy, right? Most of the folks in the 25-54 group that are not in the labor force are missing not by choice I bet. They are probably just frustrated but still want to work. Actually, no.

    Turns out that the decrease in labor force participation among prime-age individuals has been driven mostly by the share who say they currently don’t want a job. 

    I know that it can be really hard to see the link from this kind of macro labor force data and the trends in participation to your day-to-day or even year-to-year workforce planning and talent management initiatives. But I am convinced it is important for any business leader to be at least cognizant of the macro trends and dynamics that your organization and your current and future labor force operate in. Plus, charts are fun!

    But ok, enough charts for now, you can check out the Fed Atlanta's Labor Force Participation Dynamics site for even more data and analysis on this topic. 

    Have a great Thursday!

    Monday
    Sep152014

    CHART OF THE DAY: Read this while you're eating lunch by yourself

    Chances are if you are catching up on blogs on your lunch break today, you are probably at your desk, alone, while you read and munch on that tuna sandwich.

    Today's Chart of the Day comes courtesy of the retail and consumer goods research and advisory firm NPD Group that took a look at American's eating habits - specifically examining just how often people are eating alone. Turns out, you are not alone in eating alone. Take a look at the data and then some FREE commentary from me after the chart:

    A quick read of the data shows that we are eating alone about 60% of the time for breakfast and that about 55% of lunches are solitary occasions. We recover, and get more social for dinner however, with only about a third of evening meals take solo.

    What might this mean for you the HR/Talent pro? As usual, who really knows, but let's take a shot anyway.

    1. People will be more productive, (and probably happier), on the whole if they can take a complete break, even for 15-20 minutes from their work and the cognitive processing that accompanies said work. If someone never takes a break during the day time, then by about 2 or 3 in the afternoon they are likely to hit the wall, looking to some kind of artificial short-term remedy (like an energy shot which are disgusting or a candy bar, which are not disgusting but you probably don't need one), to try and make it until quitting time. If you in HR/Talent are really interested in helping people achieve the most they can at work, you are going to care if/when your entire organization seems to slow to a crawl at 3:30 every day. 

    2. Most people eat breakfast on the run and lunch by themselves at their desks because they have this sense of 'I can't take a real break, I just have too much to do', even if that is not really true. But we have gotten conditioned to see fully disconnecting from work as some kind of admission of slacking off, or of lack of dedication. We also think 'busy' equates to 'important' and while sometimes that is true, I bet the really important people at work probably are taking more social and casual lunches than most. HR pros should be mindful or at least aware of any ill-effects of burnout one symptom of which is an army of cube-dwellers eating/working through lunch day after day.

    3. If you need to 'catch' people that usually prove difficult to pin down, (Note: I am one of these kind of people), then you might want to attempt to hit them up at lunch time. Sure, there is some risk in interrupting someone's 'downtime' at lunch, but chances are they are not really taking a break anyway, they are by themselves still glued to their computer, and you won't be competing with anyone else for their time. 

    What's your take? How often are you eating lunch alone at your desk? See any problem with that?

    Have a great week!

    Tuesday
    Sep022014

    It's a short week, make sure you still put in your 47 hours

    Quick shot for a Tuesday that feels like a Monday and also feels like a Wednesday since it seems like I am already two and half days behind.

    Just before the long Labor Day weekend Gallup released some figures from its 2014 Work and Education poll that showed Americans that are employed full-time are, on average, putting in about 47 hours per week on the job, almost a full working day longer than what has been the 'standard' 40 work week.

    Here's some of the Gallup data in chart form (thanks Forbes), since we know that charts make everything better:

    The trends for both full-time and part-time workers, as you can see in the chart, have held fairly stready over time. But what also has not changed is the notion, at least held nominally, of the standard 40-hour work week.

    According to the Gallup data, only about half of full-time workers report their normal working week as 40 hours, (or fewer), with almost 4 in 10 workers reporting work weeks of 50+ hours on average. And I have a sneaking suspicion that surveys like this are under-reporting time employees spend tethered to their phones and emails that are spent at night or on the weekends.

    There is more data and analysis over at Gallup, but the real point I suppose I wanted to make here is that it probably is time to drop the '40 hours' a week notion if in fact that is not the reality for you or your organization. If you are an 'average' shop, then folks are already working almost 6 days a week now. Just face it if that is what reality suggests and expectations demand.

    And now we all better get back to work, going to be tough to cram in 47 into what is now about 3.85 workdays left in the week.

    Have a great week!

    Wednesday
    Aug202014

    CHART OF THE DAY: The Shrinking American Vacation

    Today's chart is perfectly timed for me, as starting from tomorrow I am heading out for a few days off. But my (too short) vacation I have lined up also aligns with an overall downward trend in the duration of American worker's vacations, as seen in the chart below, (courtesy of Vox). As always, some FREE commentary after the chart.


    From the data, which was sourced from the Bureau of Labor Statistics, about 9 million Americans took a full week of vacation in July 1976. Contrast that to July 2014, when just about 7 million Americans scored a full week of sun or sand or just sleeping in on the sofa. If that does not seem like a big drop over about 40 years, consider that there are about 60 million more people employed in 2014 than there were in 1976. Bottom line, this data suggests that American workers, on the whole, are not taking long (used loosely) vacations like we used to.

    What might that mean for us today? Here are three quick takes, and I would love to hear what you think as well.

    1. The paradox of constant connectivity - Smartphones, tablets, Wifi in every coffee shop, bar, restaurant, etc. should (theoretically) make it easier for workers to go on longer vacations, but for some reason that is not happening. There are pretty few places in the country/world one can run off to on vacation and not be at least somewhat reachable. So in theory the ability to be reached, to monitor work and chech emails for any dire emergencies, and actually even do some work while on vacation has never been easier. But that still isn't allowing American workers to disconnect from work as much as we used to. Why not? 

    2. FOMO - Fear of Missing Out - This phenomenon, described as a form of social anxiety, fed by smartphones and social networking, is one where we become compulsively concerned that we might miss an opportunity for social interaction, a novel experience, or other satisfying event. If you are not constantly checking your friends' Facebook and Foursquare updates, you might miss something really cool happening across town, for example. FOMO is a prety-well documented psychological dependence in social interactions, but since we use the same tools and tech more and more for work, then it makes sense that a kind of FOMO about work might be kicking in too. But in the work context, the perceived consequences of missing out might be greater. Instead of just missing a party or a Happy Hour, maybe you are missing out on some great work project or a rare chance to schmooze with the CEO. 

    3. It's a candidate's market, but the candidate's don't believe that yet - This is sort of the obvious one, where FOMO morphs into FOLOJ (Fear of Losing One's Job). Even though just about every labor market indicator is seemingly trending in a manner that suggest more power and leverage are shifting towards workers/candidates, (unemployment rate, job opening rates, time to fill, etc.), most workers are still not buying in to that story as yet. The brutal recession is not yet a distant enough memory for most of us to feel like we have either reasonable job security or a reasonable likelihood that we will find another suitable job should we lose the one we have. So we put in the extra hours, we check and respond to email at all times, and we don't go away on vacation for too long - lest anyone back at the office think, 'Hey, Steve has been out for a week, and things went just fine without him...'

    Anyway, that's it for today - I have to get back on the grind before I leave on my (short) vacation.

    No new content for a few days, but I am sure you will do just fine without me...