Quantcast
Subscribe!


Enter your email address:

Delivered by FeedBurner


E-mail Steve
This form does not yet contain any fields.

    free counters

    Twitter Feed

    Entries in demographics (14)

    Thursday
    Dec102015

    More on the performance curve

    About a year ago I published a piece called 'The Performance Curve', a quick look at how in professional baseball decades of analysis of player performance reveal a very typical average performance curve. Player performance, (hits, home runs, wins for a pitcher, etc.), almost universally 'peaks' at about age 29 or 30, and almost always begins to decline, sometimes steeply, at about age 31. The chart I used in that post is below:

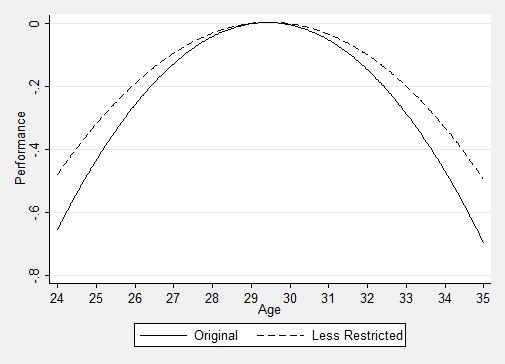
    The specifics of the Y-axis values don't really matter for the point I am after, (they represent standard deviations from 'peak' performance', but simply looking at the data we see for both the original study sample (veteran players with 10+ years of data), and 'less restricted' players, (more or less everyone else), that performance peaks in the late 20s and declines, predictably, from there. Keep this data in mind the next time your favorite team drops a 7-year, $125M contract on your best 31 year old slugger. 

    Last year my point in running the post was that these kinds of performance curves likely exist, and are becoming more discoverable, in all kinds of jobs due to the increase and improved capability of tools and technologies to better manage, track, and analyze performance. I still think those conclusions to be true a year later.

    But what got me thinking about that post from last year was yet another chart I saw this week, this one excerpted from the bank HSBC on the macro-impact of changing demographics, particularly in the workforce of industrialized countries. Take a look at the chart below, on the generalized productivity (as defined by output), across the typical worker's life-cycle:

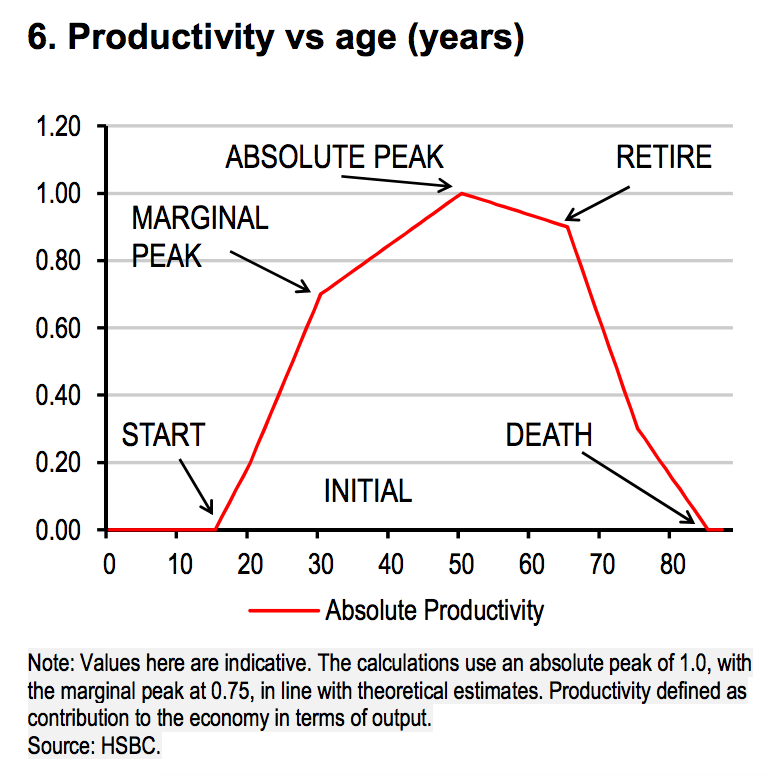
    According to HSBC, and unlike the data we see with baseball players, 'performance', (again, in this case limited to a measurement of productivity), continues to climb during a worker's life, peaking at around age 50 or so. And worth noting, even though the productivity peak hits at about 50 and this average worker still has about 15-18 more years of work ahead, that the relative productivity in that last decade+ is still relatively high.

    Said a little differently, HSBC is saying that a workforce made up of 50 - 65 year-olds would be, on aggregate, more productive than one made up of 30 - 45 year-olds, all other things being equal. Obviously, this is data that should be taken in a very general sense, as we have seen from the baseball example, there are many roles whose physical requirements negate the increased productivity effects of age/experience have on other roles. So while a 55 year-old first baseman will never be able to compete physically with a 28 year-old one, change the role from 'first baseman' to 'accounting manager' and we may have a very, very different outcome.

    Last thing I want to leave you with on this, and the thing to take away and really think about is what is happening, (again, in a general way), in labor forces across the industrialized world, and what will continue into the next 10 years or so. Here is another chart that shows how the workplace and workers are skewing older, courtesy of Jed Kolko:

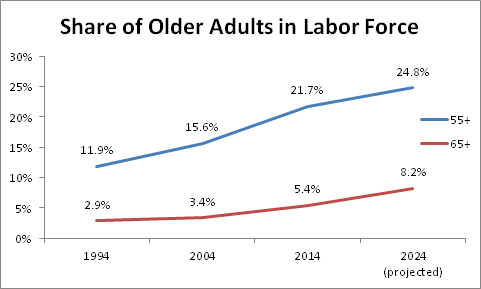
    The combination of more rapid population growth and increasing labor force participation among older workers are expected to result in about one-quarter of the workforce by 2024 being aged 55+. That is a huge increase from only 20 years prior, (1994), when the percentage of workers aged 55+ was only about 12%.  And workers 65+ are expected to make up almost 10% of the workforce by 2024, up from less than 3% just 20 years prior.

    There is plenty to think about here for sure, and as usual, no simple answers. The workforce is certainly skewing older, that seems to be indisputable. But what that means to organizational performance is not as clear, unless you are managing baseball players. For the rest of us, thinking about how these changes will or at least should impact how we hire, develop, coach, train, and mentor employees in the next 10 -15 years is probably one of the most important human capital challenges we will face. Think about it.

    Ok, that's it - I'm out. I need to get back to being super-productive (judging on where I sit on the curve).

    Wednesday
    Nov042015

    Generations in the workplace, ranked

    I have been to a few events lately, and thus have been subject to at least some 'Generations in the Workplace' content. Since many of you might still be confused/concerned/bored to death with discussions on Generations and work, I humbly submit to you this subjective, unscientific, and 100% accurate breakdown of how the generations stack up in the workplace.Source - UNC Executive Development

    Here goes...

    5. Millennials

    4. Traditionalists/Silent Generation

    3. Whatever comes after the millennials (I know that technically these folks are not yet in the workplace but that doesn't stop people from talking about them like they are already our bosses)

    2. Baby boomers

    1. Gen X

    You can comment if you like, but if you disagree with me, then clearly you must be a Millennial.

    Thursday
    Oct082015

    CHART OF THE DAY: If you're feeling old, you're not the only one

    Super simple, yet cool Chart of the Day on the graying of America courtesy of the Chmura Economics Blog - let's take a look at the chart then as you continue to demand, some FREE commentary from me...

    Wow, check the growth of the 60+ age cohort from 2000 - 2030, amazing how the other segments remain (relatively) flat, while just about everyone else, (you and me too), get a heck of a lot older.

    Why should we care about this? A few reasons I think.

    1. These general demographic trends combine with observed and predicted workforce composition trends to point to a future where the average worker will be older, will plan on working longer, and where qualified 'new' workers will be even more in demand. If your company is not one where these in-demand younger workers will want to be, then you are going to have to get used to an older workforce than you have had before.

    2. How does a relatively older workforce actually translate to HR/Talent programs? Increased need for re-training, as careers lengthen but needed skills continually change, higher reliance on benefits more likely to be used by older workers and less on those that tend to be leveraged by 20 or 30-somethings, and finally a need to be more aware and deliberate about how more widely spread age ranges can effectively work together. 

    3. Deeper in the Chmura data, they break down this 'aging effect' by US state/county, (I was not able to embed the map here, but you should click through to check it out). As you might expect, the effects of the aging population/workforce composition will differ by locality. You might want to pinpoint the county(ies) that your organization has set up shop in order to get a feel for how quickly and how pronounced the aging effect is expected to be where you need to recruit and retain.

    Bottom line, it is probably a good idea to be aware of the big shifts in demographics, at least until you have figured out a way to replace all of your workers with robots.

    And looking at how much older we all seem to be getting, you might want to accelerate the robot recruiting sooner than later.

    Tuesday
    May052015

    CHART OF THE DAY: How America will look in 2050 in one chart

    This short, but fascinating recent piece from the Washington Post is the source for today's installment of CHART OF THE DAY - a quick snapshot of how the US population is expected to change by 2050 in three key areas - religious affiliation, age, and race/ethnicity. As always, I will drop in the chart, then some FREE commentary from me after the data: 

    Washington Post

    Let's take a shot at interpreting the meaning/relevance to HR/Talent pros of each of chart's three data sets in order, shall we? Sure why not...

    1. Religious affiliation - A big trend here is the increase in the percentage of the population that will categorize their religious affiliation as 'unaffilitated', i.e., not attached to a specific or traditional religion or church. Folks who consider themselves 'spiritual' but not formal church members fall into this group. What might be the HR/Workplace implication of this trend? Kind of hard to say. Could be that more organizations over time will have to re-think their company holiday schedules and practices as fewer employees will identify with the religious-oriented holidays. Probably of the three data sets in the chart this one is the toughest to interpret.

    2. Age - This data is not surprising to anyone who watches demographic trends - a big surge in the population of older Americans, so much that the 65+ cohort will be almost the largest in the country by 2050. Of course living longer in general, means working longer into older age as well. Workplaces in the next few decades are going to have to do more to accommodate this rise in older workers through some combination of physical and environmental changes along with support and benefit programs more tailored an older workforce.

    3. Race/Ethnicity - Again, nothing really surprising in this data, America in 2050 will be less white, more Hispanic, and generally much more diverse overall. This trends has been playing out for a while, but slowly, so perhaps most HR pros are not yet doing or at least thinking differently about what it might mean for work and workplaces. At a minimum any organization that is conscious about wanting their workforces (and more importantly perhaps, its leadership ranks), reflect more closely their customers and communities are going to start to feel the pressure soon. It will be kind of a shame if by 2050 if most of the white guys we see in the workplace have C-level titles.

    Anyway, that's it from me. Share your thoughts in the comments on this data, if it matters at all to you as an HR pro, and what you and your organization might do in response.

    Monday
    Jun302014

    CHART OF THE DAY: The Changing Age Pyramid

    I know I have posted a few times previously on the how the population in general is getting older on average, and how of course as an after-effect of this general trend we will begin (if we have not already), to see our workforce getting older as well. But risking overkill on the subject, I wanted to share a really cool GIF (a first for the CHART OF THE DAY here), on what this graying of the population looks like over time, courtesy of a cool visualization from The Atlantic.

    Take a look at the GIF below (try not to get dizzy), of the standard population pyramid that charts the percentage of a population by age group, and you can get a feel for how this aging trend is playing out. Of course as always, a few FREE comments from me after the chart. Email and RSS subscribers may need to click through.

    Pretty neat, right? And you can see in the darker colored rectangles moving up the chart the effects (and the size) of the Baby Boom generation that comes on to the scene in about 1950 or so, and over time climbs the population pyramid while fundamentally changing its shape from a classic pyramid with larger percentages of younger folks forming the base, into more of a rectangle.

    What are the most important workplace implications of an increasingly aging population?

    1. The obvious one - we will have more older workers in our organizations than in the past. This will be not just because people will want or will have to work later in life than in the past, it will be a matter of necessity, as the available candidate pools for jobs will age right in step with the general population. HR pros and recruiters will have to look at say 50+ year-old candidates with a different perspective. These folks might typically have 10-15 more working years left than a similar candidate would have in the recent past.

    2. Work and workplaces will have to adapt to more older workers. That could mean redesigning work stations and processes to make them more older-worker friendly, modifying work schedules to accommodate some older workers need or desire for lighter schedules, and taking a more thoughtful approach to things like benefits programs and design to better meet older workers expectations. It seems likely that the more successful organizations will not just recognize this trend, they will make strategic decisions to better position themselves to thrive in this new paradigm.

    3. Increased rate of retirements. Although many older people will continue to work later in life, of course many will not, and most organizations can expect to see a rise in the rate of retirements as the baby boom finally begins exiting the workforce en masse in the next few years. This is kind of the most basic or first step in any workforce planning exercise, and if you have not already taken a look at the important functional areas, important skill sets, and localized regions of your workforce and taken an initial estimate of replacement needs due to anticipated increased retirements, then you probably need to start that project today. For many skills and locations, an uptick in retirements combined with a shallow candidate pool will place a strain on your ability to keep staff at needed/desired levels to meet your business objectives.

    That's it - I'm out. Thanks for playing along with the Chart of the Day on a Monday.

    Have a great week!