Quantcast
Subscribe!


Enter your email address:

Delivered by FeedBurner


E-mail Steve
This form does not yet contain any fields.

    free counters

    Twitter Feed

    Entries in labor (76)

    Thursday
    Apr022015

    CHART OF THE DAY: How's your retirement fund?

    Real quick shot for a busy Thursday...

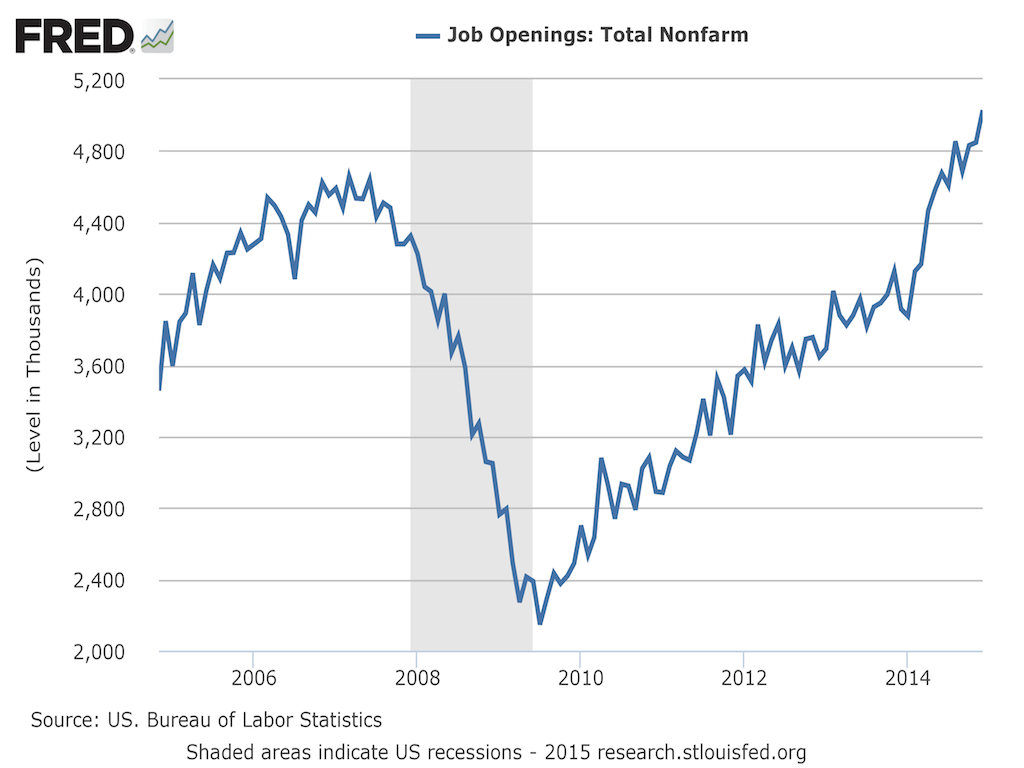
    In the last year I have hit the entire topic of the tightening labor market from a few different angles (companies reporting jobs are hard to fill, candidates control the conversation, more people are voluntarily quitting their jobs than at any time in a decade), and today I wanted to share one more data point that suggests a tougher market for employers.

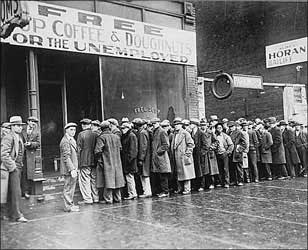
    Many folks retirement piggy banks have come back from the lows of the 2008/9 financial crisis.

    Here's the chart, courtesy of Financial Planning, and then of course some FREE commentary from me.

    Some quick thoughts:

    1. US retirement assets (from all sources) stood at $24.7 trillion at the end of 2014, an all-time high. And a remarkable comeback from the huge drop in 2008 when so many folks had to dip into their savings after they lost a job and the markets themselves were in free fall. 

    2. One of the reasons older workers have been unable or unwilling to consider either retiring or moving to some kind of reduced work schedule in the last few years, that their 401(k) balances were in the dumpster, has for many, disappeared. Sure, there might be other compelling reasons someone will extend their working career, but a rock-bottom retirement account balance is less likely to be one of them.

    3. There is no doubt in my mind that in just about every organization there are older workers who will open their 1st quarter 2015 account statements and think to themselves, "Hmm.... Maybe it's time to hang it up." And for most of these folks, it won't matter if they are the only person at the company that knows how to do XYZ or they are the one with the key relationship with important customer ABC. For them, it is just about totally a decision about $ and quality of (retired) life.

    4. HR/Talent pros - keep one eye on the S&P 500 and one eye on your voluntary termination trends this year - particularly with your experienced, senior-level, 50+ employees. I bet the two lines are going to move in the same direction, and if you don't want to be the one who has to explain what is going on in November when the CEO asks you why all the VPs are retiring at once.

    Happy Thursday.

    Thursday
    Mar122015

    CHART OF THE DAY: The decline of employer provided training

    Today's installment of the wildly popular CHART OF THE DAY series offers a selection from some light reading that you can perhaps spend some time with this coming weekend, the 300+ page long 2015 Economic Report of the President

    Nestled on page 147 of this tome, is the below chart - a look at trends in Employer-provided training and on-the-job training opportunities for the US labor force from the period 1996 - 2008 (the latest year this data was available). As always, take a look at the chart, then some witty, wry, and as always FREE commentary from me.

    The Chart:

    As you can see from the data, both employer paid for and on-the-job training activity, as reported by workers, were both on the decline from 1996 to 2008. And even with 'old' data from 2008, it seems pretty defensible to argue the ensuing few years, the tail end of the recession and the ensuing years of halting economic recovery, that trends and declines in employer paid for training would not have reversed themselves.

    So, what do we make if this data? Here goes....

    1. No one has time or much tolerance for onboarding new people who have to be 'taught' very much, at least taught more general, and transferable from one employer to another type skills. Every job ad you see for say an Accounting Manager just about demands that the person actually already be an Accounting Manager to be considered to get hired as an Accounting Manager.

    2. When employers perceive workers to have fewer attractive options outside the organization, the pressure or impetus to invest in upskilling and employee career development tails off. While this is a pretty obvious conclusion, it does not diminish its significance. By 2008 firms, often by financial necessity, had backed way off training and development. That is a short term strategy and decision that can have much greater than expected consequences once times start to improve.

    3. Employee training continues to be 'someone else's problem' for many employers. It still is really easy for organizations to demand fully trained and capable candidates for any role prior to hiring, as the fears of costs of training become sunk if and when the employee leaves present a high burden for proponents of more employer provided training to overcome.

    4. As an employee, you remain, invariably, on your own. Keep yourself ready, keep current, be willing to pay for it yourself, since fewer and fewer employers are willing to invest in you.

    Ack, that was kind of cynical. Sorry.

    Happy Thursday.

    Wednesday
    Feb252015

    CHART OF THE DAY: There's Just 5 Million Open Jobs in the USA

    Here's your latest Chart of the Day, courtesy of my two favorite online data sources, the Bureau of Labor Statistics, (specifically the Job Openings and Labor Turnover Summary, or JOLTS report), and the FRED data analysis and visualization tool.

    First, the chart, then some FREE commentary from your humble scribe:

    1. First, the actual numbers - there were 5.028 million job openings in the US on the last business day of December 2014, the highest number since December 2001.

    2. The chart shows a pretty much straight up and to the right climb in job openings since early 2009, meaning talk of the recession and the labor market disruptions it caused are really seeming far, far behind us

    3. This increase in openings is driving organizations like Walmart to raise wages for many of its workers - for a wide range of industries, and geographies, (including previously 'low worker power' ones like retail), the balance of that power is shifting. 

    4. Average weekly earnings for Production and Non-farm employees are climbing as well, not as fast as jop openings, but certainly on the same trajectory.

    So what does this mean for you, Mr. or Ms. HR pro?

    Probably nothing new, or at least nothing you have not been hearing about and likely experiencing in the last 18 months or so. 

    Lots more noise in the system to get your company and your opportunities noticed in a much more crowded market of available jobs.

    Many fewer un- and under-employed individuals around that might not always been qualified for your openings, but at least were a source of steady candidate flow. At the depths of the recession, there were about 7 unemployed workers for every job opening. Today that ratio is less than 2/1.

    You, having a harder time coming up with explanations/excuses to your leadership and hiring managers who (traditionally) are much slower to accept these changes in the labor market and the ensuing power shifts. I recommend forwarding to them the Walmart story above, with a subject line that says 'See, even Walmart is having a hard time finding and keeping people'.

    Long story short, we entering year 6 of an extended recovery/tightening of the labor market. Talent is in shorter supply, opportunities are everywhere, the Dow and the S&P 500 are at record highs, and the people you need to find, attract, and retain are well, harder to find, attract, and retain.

    Have fun, it's a jungle out there.

    Tuesday
    Feb102015

    CHART OF THE DAY: The Misery Index

    Spotted on the Pragmatic Capitalism site: The Misery Index Falls to an 8 Year Low.

    First the chart, then a quick explanation of The Misery Index itself, and finally, of course, some FREE 'expert' commentary on what if anything this kind of data means for HR/Talent pros.

    Chart:

    The "Misery" index is the sum of the rate of inflation and the rate of unemployment. It’s name is apropos because a high rate of inflation combined with a high unemployment rate are miserable things to experience. Where is the Misery index currently? It sits at an 8 year low. And perhaps more tellingly, today’s Misery index level of 6.9% is well below the 70 year average of 9.5%

    Indicative of improving economic conditions in the USA overall, we see this reflected in the declining rate of the Misery Index. Times may not be great, and the economic recovery is certainly unequally distributed, but certainly for most the worst years of 2008 and 2009 seem pretty far away at this point.

    What might the 'Misery' index have to tell the HR/Talent pro?

    One thing that comes to mind is that our perception of satisfaction or happiness and even (sorry to use the word again) engagement at work is derived from multiple and complex sources. In HR we talk plenty about engagement rates and trends and voluntary turnover and percentage of job offers accepted, but we usually only talk about these metrics in isolation. 

    We compare this quarter's engagement rate with last quarter's rate. We look at the trend line in voluntary turnover as if this phenomenon exists in a vacuum, and is not impacted or effected by other business conditions.

    We are measuring more things, but probably not getting the deep levels of insight that measurement once promised. 

    The Misery Index is a crude way to acknowledge this truth, that inflation alone or unemployment alone, don't provide all the answers as to the relative health of an economy, and consequently, the 'misery' of its citizens.

    In the workplace, perhaps we should consider our own versions of the Misery Index. Graph disengagement rate AND voluntary turnover rate together and show that to your CEO. Or maybe do a trend line with average annual salary increase against recorded absence rates to see if your 2.3% salary increases are potentially contributing to people checking out.

    Misery, (and I think, happiness too), is a complex thing. Thinking about either of them in one dimension leads to shallow understanding and conclusions of limited value.

    Plus, what is making me miserable today isn't even on any of these charts. Hint: It NEVER stops snowing where I live.

    Happy Tuesday.

    Tuesday
    Feb032015

    Two important engagement questions that employers never ask

    Caught this fascinating piece over the weekend from the Bureau of Labor Statistics Monthly Labor Review publication titled Worker's expectations about losing and replacing their jobs: 35 years of change. The piece describes changes over time in American worker's feelings about job security, confidence, and (I would argue), their ability to focus wholly on doing their actual job well, and not just trying not to lose that job.

    This data about worker's expectations comes from analysis of data from the General Social Survey which has been administered each year since 1972. The results of the General Social Survey are representative of the adult population of the United States, as the respondents are in line with population characteristics drawn from the population in surveys of the U.S. Census Bureau.

    In the piece, author Charles Weaver notes that:

    "Workers were less secure about retaining their jobs in 2010 and 2012 than in 1977 and 1978; they also were less secure about the ease with which they would find a comparable job if they were separated. As might be expected, the two measures of job security track unemployment, although other factors certainly play a role as well"

    This conclusion is drawn from the responses to the following two specific survey questions (repeated every year in the survey)

    1. Thinking about the next 12 months, how likely do you think it is that you will lose your job or be laid off—very likely, fairly likely, not too likely, or not at all likely?

    2. About how easy would it be for you to find a job with another employer with approximately the same income and fringe benefits you have now? Would you say it would be very easy, somewhat easy, or not easy at all?

    As Mr. Weaver reports, over time the number of workers who felt it was very likely or fairly likely to lose a job or be laid off rose to 11.2% from 7.7%, while only 48.3% felt it would be very easy or somewhat easy to find a comparable job, down from 59.2% in the late 1970s.

    So in the period from about 1977 to 2012 job security on the macro level had declined, while confidence in one's ability to find a comparable job had also declined. There are potentially thousands of reasons for these declines, and while important, and interesting, are not why I wanted to post about these findings today.

    What I thought about was the two questions themselves, and how an individual worker feels about them might relate to their job satisfaction, performance, and potentially their engagement.

    Are you in fear of losing your job or getting laid off? If you were laid off, how easy/hard could it be to find a comparable job?

    The answers to these questions can tell you plenty about workers. They speak to uncertainty, fear, anxiety, etc. about work and their livelihoods. The less optimistic one feels about job security, the more likely they are to approach work as something to fear, a place not to screw up, and I think these kinds of fears might improve short-term performance, (and other things not directly related to performance, like showing up on time, following rules, etc.)., but a anxious worker is not going to be a happy worker, (or an engaged worker) very long.

    For those reasons, (and probably more), employers would probably like to know how their employees would respond to the two questions above. Wouldn't you like to know if your workers are tiptoeing around, hoping the other shoe isn't about to drop?

    Sure. But here is another sure thing. You will never find either of those two questions on any internal employee survey.