Quantcast
Subscribe!


Enter your email address:

Delivered by FeedBurner


E-mail Steve
This form does not yet contain any fields.

    free counters

    Twitter Feed

    Entries in labor (76)

    Friday
    Sep092016

    CHART OF THE DAY: There's almost no one left to fill your open jobs

    I am an absolute mark for big picture labor market data. And the best, most interesting regular look at labor market data os the Bureau of Labor Statistics monthly Job Openings and Labor Turnover Survey report, better known as the JOLTS report.

    Federal Reserve Chair Janet Yellen has stated that the JOLTS report is one of the most important data sets she relies on when pondering the Fed's decisions on monetary policy, and if the JOLTS is good enough for J-Yell then you had better believe the rest of us should be paying attention to it as well.

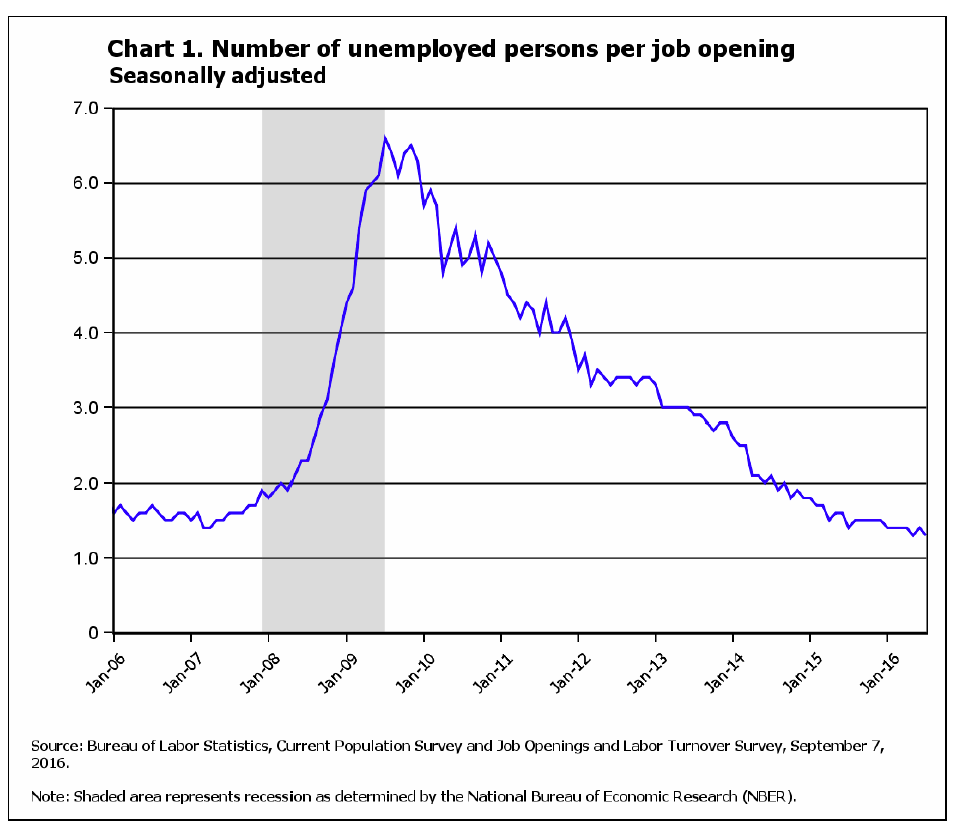
    For today's Chart of the Day, take a look at what's happening with the ratio of unemployed persons to current job openings - a fixture of the JOLTS data. First the chart, then some comments from me after the data.
    Some quick thoughts on the data:

    1. When the most recent recession began (December 2007), the number of unemployed persons per job opening was 1.9. The ratio peaked at 6.6 unemployed persons per job opening in July 2009 and has trended downward since. The ratio at the end of July was 1.3 unemployed persons per job opening. This represents the all-time low in the ratio since it has been calculated by the BLS.

    2. In addition, the very same JOLTS report shows that the denominator of the ratio, the number of current job openings in the US is also at a record level, hitting 5.9 million at the end of July. 

    3. This data reminds us that it is both a great and terrible time to be in recruiting/talent acquisition. Let's start with the terrible part. For lots of jobs and locations there simply are not enough (qualified for sure), candidates to form an adequate pipeline for the roles you need to fill. There are fewer unemployed persons overall, workforce participation rates remain really low by historical standards, (a subject to its own), and lots of people with desirable skills are coming to terms with their power and negotiating leverage in the market. When you have to pry someone away from the job they already have, that gives a little bit of power to the person that in worse economic times they would not enjoy.

    The good news is that the same JOLTS report that shows the ratio of unemployed persons per job opening is at an all-time low, also shows that the 'Quits' rate, i.e., the percentage of workers who are voluntarily leaving their jobs continues to trend upward - hitting 2.0% in July, which equates to about 2 million quits. In other words, workers continue to express confidence in the labor market and willingness, (almost at a pre-recession rate), to quit the job they have now, to (in theory), take the job you are trying to fill. If you can make a compelling offer, chances are at least decent you can pry someone out of where they are now to take it. And you may have to as the unemployed/jobs ratio continues to fall, and nothing seems to be significantly moving the needle to entice more people back into the workforce who are currently on the sidelines.

    There is plenty more in the report, but I think you get the idea and I will leave it to you to dig in more. The JOLTS report should be your monthly must-read if you are interested at all in what is happening at a macro-level in the US labor market. Bookmark this page and thank me later.

    Have a great weekend!

    Monday
    Aug292016

    Three quick 'Gig Economy' links and a warning for HR leaders

    There are about 12,238 surveys and data points that you can unearth when researching the rapidly evolving, and probably growing, 'gig economy', i.e. work that is performed by independent contractors, self-employed types, and those that for better or worse, (worse), get referred to as '1099 workers', for the IRS form on which their earnings are reported.

    Rather than spit out a bunch of (sometimes contradictory) data on how and where this gig economy is heading, I wanted to share three quick and interesting developments in this area that are worth thinking about and then one more recently released set of survey data that should be a warning to HR and business leaders that are moving towards increased usage and reliance on 'gig' workers.

    Item 1 - Atlassian now lets you hire freelancers right from Jira

    JIRA, Atlassian’s flagship project management service, is getting a new feature today that will let you easily convert JIRA tickets into job postings on Upwork’s freelance marketplace. “The smartest people will always exist outside of your company,” Atlassian’s head of growth for JIRA and Bitbucket Sean Regan told me. For many companies — and especially small startups — it’s also hard to have all the right expertise available in-house to solve every problem. With this new integration, these companies can now click a button in JIRA and get a pre-populated form to submit to Upwork’s marketplace.

    Steve here - an example (of which we will see more I am sure), of enterprise technology and management tools integrated with sourcing/hiring platforms for 'Gig' workers 

    Item 2 - LinkedIn enters the Gig Economy with an Upwork competitor

    LinkedIn has created a freelance marketplace. Launched on Wednesday, "LinkedIn ProFinder" asks employers to submit contract jobs in categories such as design, writing, or financial services and promises to send them up to five free quotes from LinkedIn users in response. Over the last five years, the number of freelancers on LinkedIn has increased by 50%, according to the company.

    Steve here - Of course it makes sense for LinkedIn to dive in more heavily into the 'Gig' work space. It's growing, and LinkedIn thinks/knows it has the way to connect gig workers with opportunity

    Item 3 - This CEO says he was shut out by tons of investors in Silicon Valley for classifying his workers as W-2 employees

    But Josh Bruno, the CEO of senior-care startup Hometeam, said that for him it was always clear that Hometeam's 1,000-plus caregivers needed to be on W-2s. They needed a lot of training, and Bruno wanted to give them the sense that Hometeam was investing in them for the long haul.

    But unfortunately, when Bruno was trying to raise money, that wasn't what Silicon Valley VCs wanted to hear.

    "I was kicked out of every office on Sand Hill Road," Bruno said, referring to the iconic street that houses many famous Silicon Valley VCs. Bruno said he even had a verbal agreement with a "flashy name" VC, who then wouldn't go through with the investment unless Bruno put his workers on 1099s.

    Why? One reason, Bruno said, is because big names like Uber and Lyft were doing it. Bruno's main competitor, Honor, which was named one of Business Insider's hottest San Franciscostartups to watch in 2016, originally used 1099s. It has since switched to W-2s.

    But it wasn't simply because everyone was doing it, Bruno said. The deeper reason rested in what a 1099 represented.

    Bruno said that to VCs he spoke with, a 1099 meant a job that was both easy and repeatable. The worker is a part that can be swapped in, which is good because it means the business will be easier to scale, Bruno explained. And it would be easier to get the kind of growth the VCs were looking for.

    Steve here - In case you wondered what the general attitude of 'people who have money and are looking to have more money' is towards labor, there you have it. 'Gog' workers are cogs, more or less the same, more or less interchangeable. This isn't a problem until.... Well, let's ask some of the Gig workers.

    And as promised, here's your warning, 67 percent of Americans who have worked as independent contractors would choose not to do so in the future (infographic below courtesy of Deloitte).

    A recent online poll by Deloitte of nearly 4,000 workers found that 67 percent of respondents who have worked as an independent contractor would choose not to do so again in the future. Additionally, more than 60 percent of employed workers said that their stability would suffer if they moved to independent contract work, and 42 percent worry about sacrificing good compensation and benefits.

    Steve here - Lots of interesting nuggets to take away from the Deloitte data, but they all point to the same place - that many, many 'Gig' workers are not at all happy to be Gig workers, and that most organizations are doing a terrible job managing and engaging these gig workers. it's almost as if the Silicon Valley VC attitude towards labor is taking hold and becoming more common.

    The danger is at the same time you as an organization make the strategic move to increase your use of Gig workers, and the tools and technologies are making it easier for you to incorporate Gig workers into your processes and workflow, that the way we value, treat, and support Gig workers seems to be getting worse. And lots of Gig workers are not happy.

    Plenty to think about here as the next few years play out.

    Have a great week!

    Wednesday
    Aug242016

    Have to advise your kid on their college major? Here's some data you may want to review

    Time to dig into some labor market data!

    (Note: all the data referred to in this post can be found courtesy of our pals at the BLS. While their site isn't the easiest to navigate, you can start at the 'Employment, Hours, and Earnings' page to get started with this kind of analyses).

    I had a chat with a friend recently who was sending their child off to his or her, (I can't remember which, does not matter), first year of college this month. In the conversation I faked genuine interest by asking what the child was planning to choose as their major. I think the answer was 'Business' or 'Physics', like I said, I was faking interest at this point, but the entire conversation made me think about just what 'should' the child have chosen, forgetting for now what they are interested in/good at. If the child wanted to make a purely rational, economic decision, what might be the direction to head in terms of college major?

    I confess to not knowing the answer, but a recent piece from the Nieman Lab about trends in employment in selected information industries, (copied below), at least provides one set of data points to (hopefully), better inform these kinds of economic decisions. Take a look at the Nieman Lab chart, (knowing by accessing the BLS data in the link above, you could create similar charts across other or all industry classifications), and then some comments from me after the data.

    The point of the Nieman Lab piece was more or less 'Gee, what a crappy last decade it had been for the newspaper business, and the people working in it', but examining this kind of data a little more broadly can be instructive on a number of levels.  Sometimes this kind of data validates what we think we know or have observed in our own lives - do you know anyone who actually reads a newspaper anymore?

    Other times the data can be a bit surprising too. I personally had no idea that employment in Motion Picture and Video Production had just about doubled since 1990. Are there really that many more films being made? Besides the Sharknado series I mean?

    Back to the original question raised in the post - what should someone making what they hope to be is a rational, economically sound decision choose for their college major? 

    Some topic or subject that maps easily to an industry group we think holds bright employment prospects for the future? 

    I still have no idea I suppose. But at least I would tell them to not plan to work for a newspaper after they graduate. 

    And then I would take a minute to explain what a 'newspaper' is.

    Happy Wednesday. Have fun with the data.

    Monday
    May162016

    CHART OF THE DAY: More Americans are Working Longer

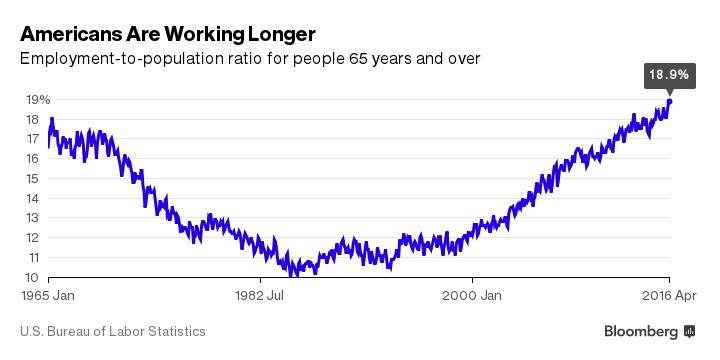
    I am a total mark for labor force data and today's Chart of the Day fits the bill perfectly. Check out the below chart on the Employment to Population ratio for Americans aged 65 and up over the last 50 years, and of course some FREE comments from me after the data

    (Chart courtesy of Bloomberg)

    Lots of interesting points we can tease out of this data, so let's go..

    1. Just under 19% of Americans age 65+ are currently in the workforce, according to the BLS. This is the highest percentage of working people in this age cohort since the early 1960s. 

    2. Why are folks in this age cohort working in greater numbers than before? The most commonly cited reason according to a recent study from Transamerica is that they need the income and benefits. The financial crisis, and the tech bubble that busted a few years before that, devastated many baby boomers' retirement savings accounts, and has forced them to work longer than they had originally planned.

    3. The next most commonly cited reason for 65+ folks to remain in the workforce is that, well, they like their jobs and want to remain a part of their organizations. You probably know, or maybe feel this way yourself, that traditional 'retirement' is not at all that appealing. From the same Transamerica survey, 36% of respondents indicated enjoying their work and wanting to stay involved in the workforce was a primary reason to delay or postpone traditional retirement.

    4. Finally, a couple of other trends are factoring in to help drive the employment ratio up for older workers. Some organizations need the experience and expertise of these workers, and would have a difficult time replacing them should they begin to retire in greater numbers. In certain, less exciting industries, these older workers remain essential to the organization, and are being incented to stay in the labor force. And one more thing - folks are just living longer and remaining more productive later in their careers than in the past.

    Add it all up and it seems that these trends suggest that more and more of the workforce will be comprised of older, 65+ workers. Business and HR leaders that want to take best advantage of this situation will make sure they are not ignoring older workers in their recruiting, are willing and able to make necessary adjustments and accommodations as needed, and are actively engaging their older workers in important projects and in mentoring their younger, less experienced workers.

    We are all getting older. It just seems like it is happening all at once.

    Have a great week!

    Tuesday
    Apr262016

    CHART OF THE DAY: Trends in Labor Force Participation

    It's been ages since I broke off a CHART OF THE DAY post and even longer since I talked about the Labor Force Participation Rate, so let's remedy both of these situations in one shot.

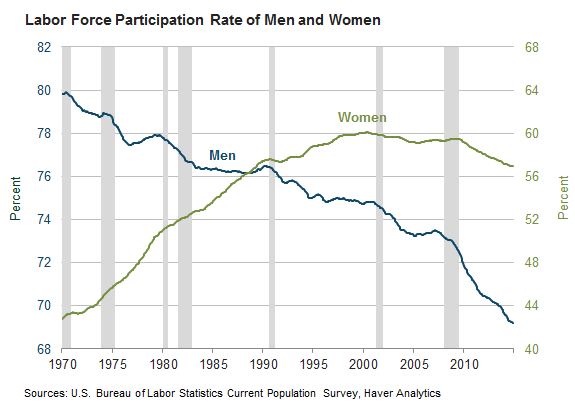
    Courtesy of your pals at the Federal Reserve Bank of Atlanta, have a look at a recently published chart on participation, this one broken down by gender. As always, some insightful comments from me after the data:

    Let's break down the data a little, and see if we might (Shock!) learn something. Some observations...

    1.  Male labor force participation has been on a long and steady decline for ages. In fact, males, as a group, have been less and less inclined to participate in the labor market since at least World War II.

    2. The female participation rate increased from about 43 percent in 1970 to a peak of 60 percent in the late 1990s, from which it has remained relatively flat over the last 15 - 20 years.

    3. But despite the economic recession of 2007 - 2008 ending, the data show that between 2010 and 2013, participation declined even more steeply for both men and women. Average female participation in 2014 was 57 percent—the lowest level since 1988—and male participation was down to a record low of 69 percent.

    What should we think about when considering this data? After all, participation is influenced by numerous factors like workforce age, prospects, disability rates, desire to continue schooling, etc.

    Let's look at what the Atlanta Fed thinks is the near-term direction for Labor Force Participation:

    "As a guide, the Bureau of Labor Statistics projects that the factors pulling down the labor force participation rate will outweigh those pushing it up, and that by 2022, labor force participation will be 61.6 percent, 1.4 points below its level at the end of 2014."

    The trends and the predicted continuation of these trends suggest a labor market that is even tighter than we are experiencing currently. It seems also likely that the kinds of jobs that will be hardest to fill are not the ones that will be easily filled by simply coaxing more people back into the labor force. 

    If anything, a declining participation rate makes even seemingly 'easy' to fill jobs that much harder to fill.

    Long story short, this data suggests that filling all kinds of jobs is just going to get tougher. It's probably a good time to be a recruiter though.

    A good recruiter I mean.