Quantcast
Subscribe!


Enter your email address:

Delivered by FeedBurner


E-mail Steve
This form does not yet contain any fields.

    free counters

    Twitter Feed

    Entries in workforce (77)

    Friday
    Jul292016

    CHART OF THE DAY: Big Trends in Working Age Population

    Super quick hit for a summer let's-get-out-of-here-and-head-to-the-beach Friday where, at least here in the USA, many of us are going to tire of the phrase 'Corn Sweat' (go ahead and Google it).

    Today's chart comes from our pals at the Economist, from a piece titled 'Vanishing Workers'. First the data, then some quick observations from me before you can power down and crack out the sunscreen.
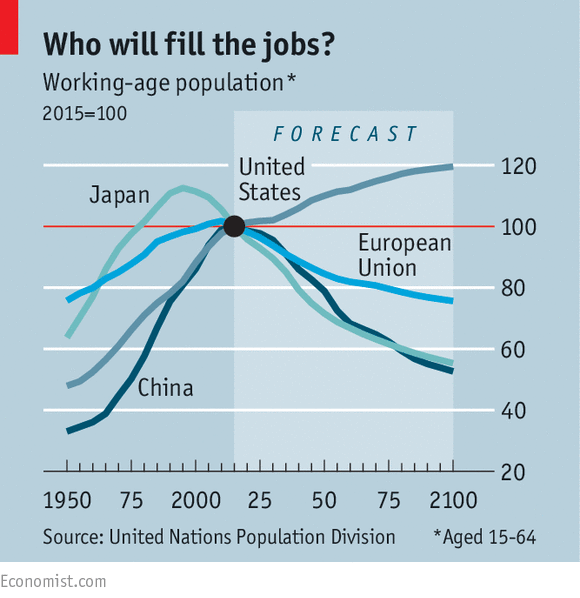
    In a nutshell, this data suggest the working age populations, (15 - 64),  in China, Japan, and Europe are all set to fall (relative to a 2015 baseline), somewhat dramatically in the next few decades, while by the same measure, this group will continue to rise in the US, (albeit at a slower rate than the recent past).

    What happens (in general), when there are relatively fewer available workers, and what might be the implications in the USA where we will be bucking against this trend?

    1. Fewer workers generally lead to rising wages, at least in the near term. And there is plenty of evidence of this already happening in China, where increased competition for workers (especially in manufacturing), has driven up wages for these workers, and made many firms think again and re-evaluate the cost advantages of locating these kind of operations in China.

    2. Falling working age populations impact industries in different ways. With fewer workers, (and an increase in the dependency ratio, the total number of children and elderly divided by the working age population), housing and construction tends to suffer, as there is less demand for new, and larger housing from workers overall. But health care, child care, and related service industries might fare better, with an increased burden of care demanded by larger proportions of kids and older people.

    3. For the US, one of the few industrialized economies that will not see such a fall in working age population over the coming years, the news is pretty positive. Larger proportions of working age folks tend to have a pretty direct and beneficial impact on GDP, output, and overall quality of life. And of course more folks in their prime earning years reduces the overall drag on the economy that can result from a higher dependency ration, all things being equal. There should be less need to raise payroll and corporate tax rates for example, in order to continue to fund things like Medicare and Social Security. The downside risk of course, is that jobs and opportunities for workers have to rise commensurately with this demographic trends, or else you end up with higher than desirable levels of unemployment or under-employment. But balanced against the alternative, potentially not having enough prime age workers to meet demand, (which will send investment elsewhere), it seems the US position to be the more desirable one in the long term. And for my line of work, the HR Tech space, it seems clear that growth and opportunity for HR Tech companies will continue to primarily reside in the USA, as Europe and other countries working age cohorts, (the 'users' of HR Tech), continue to fall.

    Love the data. Love labor market demographics. If that makes me some kind of a geek, so be it.

    Me fretting over me Level in Pokemon GO also makes me a geek, but for a different reason.

    Monday
    May162016

    CHART OF THE DAY: More Americans are Working Longer

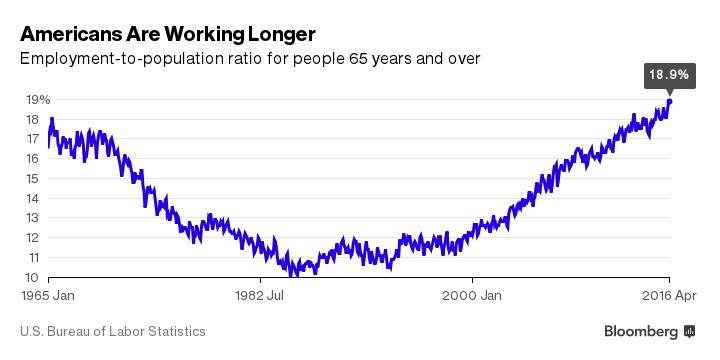
    I am a total mark for labor force data and today's Chart of the Day fits the bill perfectly. Check out the below chart on the Employment to Population ratio for Americans aged 65 and up over the last 50 years, and of course some FREE comments from me after the data

    (Chart courtesy of Bloomberg)

    Lots of interesting points we can tease out of this data, so let's go..

    1. Just under 19% of Americans age 65+ are currently in the workforce, according to the BLS. This is the highest percentage of working people in this age cohort since the early 1960s. 

    2. Why are folks in this age cohort working in greater numbers than before? The most commonly cited reason according to a recent study from Transamerica is that they need the income and benefits. The financial crisis, and the tech bubble that busted a few years before that, devastated many baby boomers' retirement savings accounts, and has forced them to work longer than they had originally planned.

    3. The next most commonly cited reason for 65+ folks to remain in the workforce is that, well, they like their jobs and want to remain a part of their organizations. You probably know, or maybe feel this way yourself, that traditional 'retirement' is not at all that appealing. From the same Transamerica survey, 36% of respondents indicated enjoying their work and wanting to stay involved in the workforce was a primary reason to delay or postpone traditional retirement.

    4. Finally, a couple of other trends are factoring in to help drive the employment ratio up for older workers. Some organizations need the experience and expertise of these workers, and would have a difficult time replacing them should they begin to retire in greater numbers. In certain, less exciting industries, these older workers remain essential to the organization, and are being incented to stay in the labor force. And one more thing - folks are just living longer and remaining more productive later in their careers than in the past.

    Add it all up and it seems that these trends suggest that more and more of the workforce will be comprised of older, 65+ workers. Business and HR leaders that want to take best advantage of this situation will make sure they are not ignoring older workers in their recruiting, are willing and able to make necessary adjustments and accommodations as needed, and are actively engaging their older workers in important projects and in mentoring their younger, less experienced workers.

    We are all getting older. It just seems like it is happening all at once.

    Have a great week!

    Tuesday
    Mar012016

    CHART OF THE DAY: How large is the 'gig' economy?

    In my 'What HR should and should not be talking about in 2016' piece from early January I had the 'gig' economy listed as one topics that we collectively needed to stop talking and thinking so much about this year. By way of refresher (mostly for me), here is what I said in January about the 'gig' economy:

    "The 'Gig' Economy - Here's the thing about the rise in importance of the so-called 'Gig Economy', it is quite possible that its growth as a percentage of the labor force has been generally exaggerated possibly due to the oversized coverage that the largest Gig company, Uber, has received over the years. According to this Wall St. Journal piece from last July:

    Far from turning into a nation of gig workers, Americans are becoming slightly less likely to be self-employed, and less prone to hold multiple jobs. Official government data shows around 95% of those who report having jobs are accounted for on the formal payroll of U.S. employers, little changed from a decade ago.

    If Uber and its ilk were fundamentally undermining the relationship workers have with employers, that shift would be showing up in at least some of the key economic indicators. Hundreds of thousands of Americans, or even a few million, may have dabbled in the gig economy, but in the context of the 157 million-strong U.S. labor force, the trend remains marginal.

    It is possible that since there are likely more 'Gig' workers in coastal 'elite' cities like New York and San Francisco, and folks in these cities dominate the conversations in the media, that it just feels like the Gig economy is fast becoming the dominant form of work. But the data just doesn't reflect that, at least not yet. And it likely will not in 2016 or in 2018 or maybe even in 2020. So for now, it makes sense to think about your labor force composition, sure, (just like it always has), but massive, fundamental changes in that mix of labor is not typically top of mind for most organizations."

    So that was my take in January and two months later I have not really seen much if anything to make me think any differently about how important/influential the 'gig' economy really is to the vast majority of workers, organizations, and HR leaders. Today's CHART OF THE DAY courtesy of the JPMorgan Chase research folks seems to back that conclusion up.

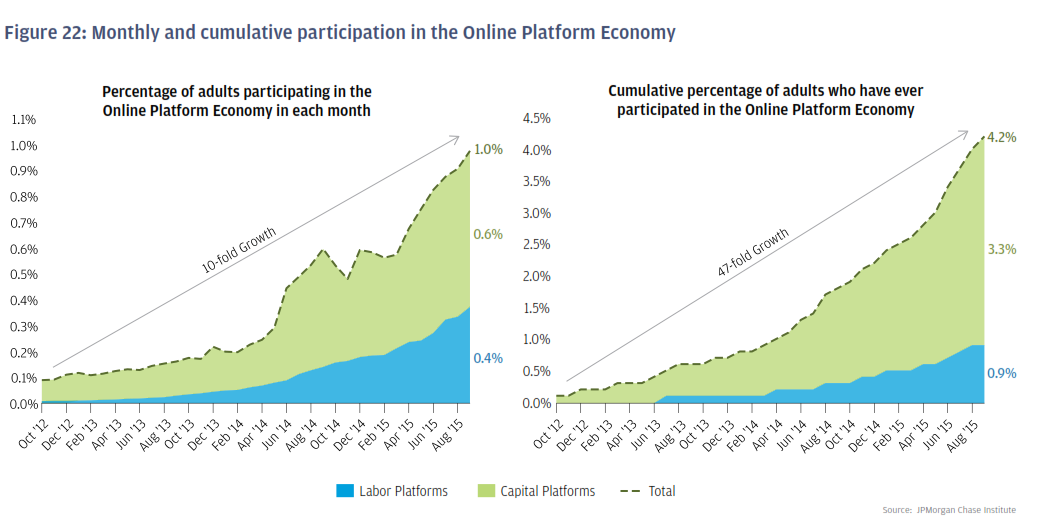
    Taken from a three-year study of over 1 million JPMorgan Chase customers, the survey titled 'Paychecks, Paydays, and the Online Platform Economy' attempted (among other things) to get a better understanding over a three-year period just how important the 'gig' economy was/is in terms of worker participation levels and contribution to overall individual income. The entire report is interesting, but the chart I want to share is below, on the overall participation rates in 'gig' work. Here is the data, and the as you demand, some FREE comments from me:

    Apologies if some of the figures on the charts are a little tough to read, so I will just repeat the headline numbers - in Sept. 2015 the final month of the study, about 1% of individuals earned income from the 'gig' economy. In the second chart we see that in the 3-years of data up to Sept 2015, that about 4% of individuals had at any time earned income from the 'gig' economy.

    So 1% of JPM's surveyed customers were active on Uber, AirBnb, EBay ,and the like in Sept 2015 and 4% of people overall at some time earned some income from working (or selling things), on one of these platforms.

    While both figures represent significant growth in the reporting period, both were growing from incredibly small starting points. The truth is that the vast majority of people are not participating in these platforms and the ones that are, (another major section of the survey data), are using it as a supplement to more 'regular' forms of income, i.e. 'normal' jobs. Said differently, the chances are the only Uber drivers you have ever met are the ones that have driven you somewhere.

    To get back to my original point from January, while we read lots and lots about the 'gig' economy, its actual impact and influence on most worker's lives is not all that significant, at least not yet. If you are at all interested in this kind of data, I encourage you to check out the full JPMorgan Chase study here.

    Thursday
    Feb252016

    Yelp and a missing piece of HR Tech

    By now I am pretty sure you've heard the story of the call center rep at Yelp who was summarily fired after posting an 'open letter' to the CEO claiming (among other things), that the company's failure to pay a living wage was placing her and her colleagues under tremendous financial pressure. Here's a quick two paragraphs from coverage of the letter and the firing from the Washington Post:

    The Yelp employee who said she was fired after she blogged about the financial pressures she felt while working for the multibillion-dollar business said Monday that her breaking point came one night when she went to sleep — and woke up "starving" two hours later.

    Talia Ben-Ora posted an open letter Friday afternoon to Yelp chief executive Jeremy Stoppelman, saying she wasn't earning a living wage while working in customer support at Eat24, Yelp's San Francisco-based food delivery arm.

    She was out of work hours later, she said.

    Yesterday at the HR Capitalist, KD had some great takes on the entire Yelp employee hullaballo, but it was this one, KD's point #3 that I found the most interesting and wanted to expand upon a little bit here:

    "The company has some responsibility here as well.  It's San Francisco, people. Maybe 20K annualized jobs don't belong in the Bay Area.  It's called workforce planning - put a call center in Detroit and do some civic good. "

    KD is quite correct of course, it doesn't make a tremendous amount of sense to attempt to locate, staff, retain, and motivate the team for a call-center or similar kind of low-wage filled business operation in one the most expensive cost of living places in the world.

    Heck, there have been reports that teachers, police officers, nurses and many other professionals can't afford to live in San Francisco or the nearby cities and towns that the tech boom in Silicon Valley have made incredibly expensive compared to most of the rest of the country. Super expensive places to live and work are always going to be extremely challenging for workers on the lower end of the wage scale, as made clear by the ex-Yelp employee's post.

    So let's get back to KD's point - Yelp shouldn't realistically try to locate a call/service center, staffed by what the market would force to be low-paid workers, in a place like San Francisco. The reason this point resonated with me is that for a long time I have thought that one of the big gaps in the HR technology landscape was a solution or platform for helping organizations make these kinds of decisions - the 'Where should we locate the call center?' ones that the Yelp story reminds us are so important.

    In fact last year when I was setting up the first-ever HR tech hackathon at the HR Technology Conference, I toyed for a time with making the 'challenge' for the hackers would have to tackle be that very thing - to build a tool that would help HR and organizational leaders answer the 'Where should we locate the call center?' question.

    So what kinds of considerations and inputs would such an HR technology that could help answer that question have to encompass?

    Here's a quick, incomplete list...

    1. Inventory of the needed talent/skills to staff the call center, (I am going to keep using the call center example, but the technology would naturally have to be flexible enough for all kinds of workforce planning decisions).

    2. Assessment and comparison of the available talent/skills to the needed set of talent/skills from Step 1. This would have to factor in the existing employee base, the candidate/prospect database and funnel, the alumni database, public networks like LinkedIn, 'on-demand' portals like Elance, and perhaps other external candidate repositories or resources like local staffing companies. Somehow you would need a decent idea of the addressable talent/skills that could be applied to the needs developed above.

    3. Capability to cost and analyze a range of options with different talent mixes from the potential sources above. In other words what difference does it make if we staff using 80% temps/contractors and 20% FTEs? How much longer and more costly would it be to push the FTE level to 40%? What are the chances we could even find enough readily available talent in the local market to choose that mix?

    4. Ability to incorporate site specific factors like land/building acquisition costs, infrastructure costs, tax implications, cost of compliance with any local regulations, and the 101 other things that go into building or leasing, (and then maintaining), company facilities. 

    5. And finally, incorporate, or at least make folks aware of other factors that could influence the decision like an evaluation of how average commuting time/cost might be impacted by the choice of location of the new call center, the likelihood of delays in facility construction or with acquiring needed permits, or any location specific elements like local climate or even political landscape.

    There are probably lots of other factors that any major business decision like 'Where should we locate the call center?' would need to be taken into account, but I think at least I touched on the obvious ones. And the fact that these kinds of decisions are so complex, involve data from so many disparate sources, and have to be incredibly flexible in order to adapt to meet the requirements of highly complex scenarios is probably the reason why a technology for this use case does not seem to exist.

    So to circle this back to the Yelp story it is for sure an accurate observation that trying to run a call center operation in a high-cost place like San Francisco is likely a terrible, no good idea.

    But where should the call center be located? 

    That's a simple question that is hard to answer. I hope that we will see some movement in the HR tech space in the coming years that will help to make answering that question a little easier, and will help lessen the kinds of situations like the one about the starving Yelp employee.

    Tuesday
    Jan052016

    CHART OF THE DAY: Is it a good time to find a quality job?

    Guess what? CHART OF THE DAY is back for another year of stats, data, and information about work, labor markets, demographics, basketball, and Tom Cruise movies. 

    For new blog readers, here is a quick reminder of how CHART OF THE DAY works. First, I find what I think is an interesting chart, graph, Venn diagram, or my favorite an exploding Pie chart that helps visualize some data set I find intriguing. I re-publish the chart here with a link back to the original source. Last, I toss out 2 or 3 thoughts on the data's significance or relevance for those of us in the HR, talent, technology, workplace spaces.

    Got it? Okay, here goes...

    For 2016's first submission courtesy of Business Insider and Gallup, a look at what American's think about the question "Is it a good time or a bad time to find a quality job?"

    Some quick thoughts about the data:

    1. Gallup has been asking this question in their surveys since 2001, and the latest data from 2015 that shows the percentage of Americans that feel it is a good time to find a quality job sits at 42%, which is just a shade under the series' all-time high of 43% from 2007. Said a little differently, since 2001, according to this survey American's attitudes about the job market conditions have NEVER been more optimistic.

    2. Gallup didn't specifically survey people 'actively' looking for work, so we can assume the increased confidence in the labor market is a reflection of the broader population's attitudes. That means just about everyone is feeling if not good, at least relatively better about labor market conditions. Which translates to the likelihood of increased turnover, even for those employees that you thought were 'safe', i.e., not likely to seek opportunities elsewhere. Will 2016 be the year that more people seek greener grass elsewhere? Maybe so.

    3. The recent HR technology trend towards developing 'predictive' models for providing insights into things like attrition and retention can provide tools that can possibly help HR leaders in this area. But the key question I would ask my HR technology provider of such predictive tools is the extent to which, if at all, these tools take into account these external trends in worker attitudes. Does the tool adapt to reflect the macro-trends and environmental conditions that exist and impact organizations? Or will your 'predictive' tool really act like more of a 'reactive' tool, failing to adapt quickly enough to changing market conditions? Good questions to ask. 

    Ok that's it, I'm out.

    Happy Tuesday!