Quantcast
Subscribe!


Enter your email address:

Delivered by FeedBurner


E-mail Steve
This form does not yet contain any fields.

    free counters

    Twitter Feed

    Entries in workforce (77)

    Thursday
    Feb152018

    The changing mix of employee compensation increases

    TL:DR - More and higher one-time bonuses, fewer and less annual salary/wage increases

    In the aftermath of the recent tax reform legislation passed by the US Congress and signed by the President, you certainly must have noticed a pretty long list of major organizations who reacted to the reduction in the US corporate tax rate by (among other things), awarding bonuses (oddly, almost all exactly in the amount of $1,000) to their employees.

    Here is just a short list of select companies who have shared this windfall with their employees in the form of one-time bonuses:

    Alaska Air, American Airlines, AT&T, Bank of America, Comcast, Disney, Home Depot, Lowe's, Southwest Air, Walmart, Waste Management - and there are lots more.

    The companies above, (and plenty others) have directed the employee rewards portion of their expected tax cut windfall to these one-time bonuses, while a few others (Aflac, Boeing, Cigna, FedEx, Honeywell, UPS, Visa), have either supplemented these one-time bonuses with other employee rewards improvements - increases hourly wages, 401(k) contribution enhancements, and/or stock-based rewards.

    But the vast majority of publicly announced employee rewards increases as a result of the corporate tax cut have been these seemingly ubiquitous one-time $1,000 bonuses. It is almost odd, (and if you are a conspiracy lover, curious), that so many companies in different industries all settled on this same bonus amount. Weird...

    But these tax cut bonuses also draw our attention to a larger trend in employee compensation increases, one that pre-dates the recent surge in one-time tax cut bonuses - the trend of companies allocating more payroll budget towards one-time and variable awards, and relatively less budget to annual (and in theory, recurring), salary/wage increases. Said differently, more and more of the compensation increase that an average worker might see is tied up in discretionary and variable methods, like one-time bonuses. Check out this chart from a piece in the NY Times, reporting on an Aon Hewitt study of the topic:

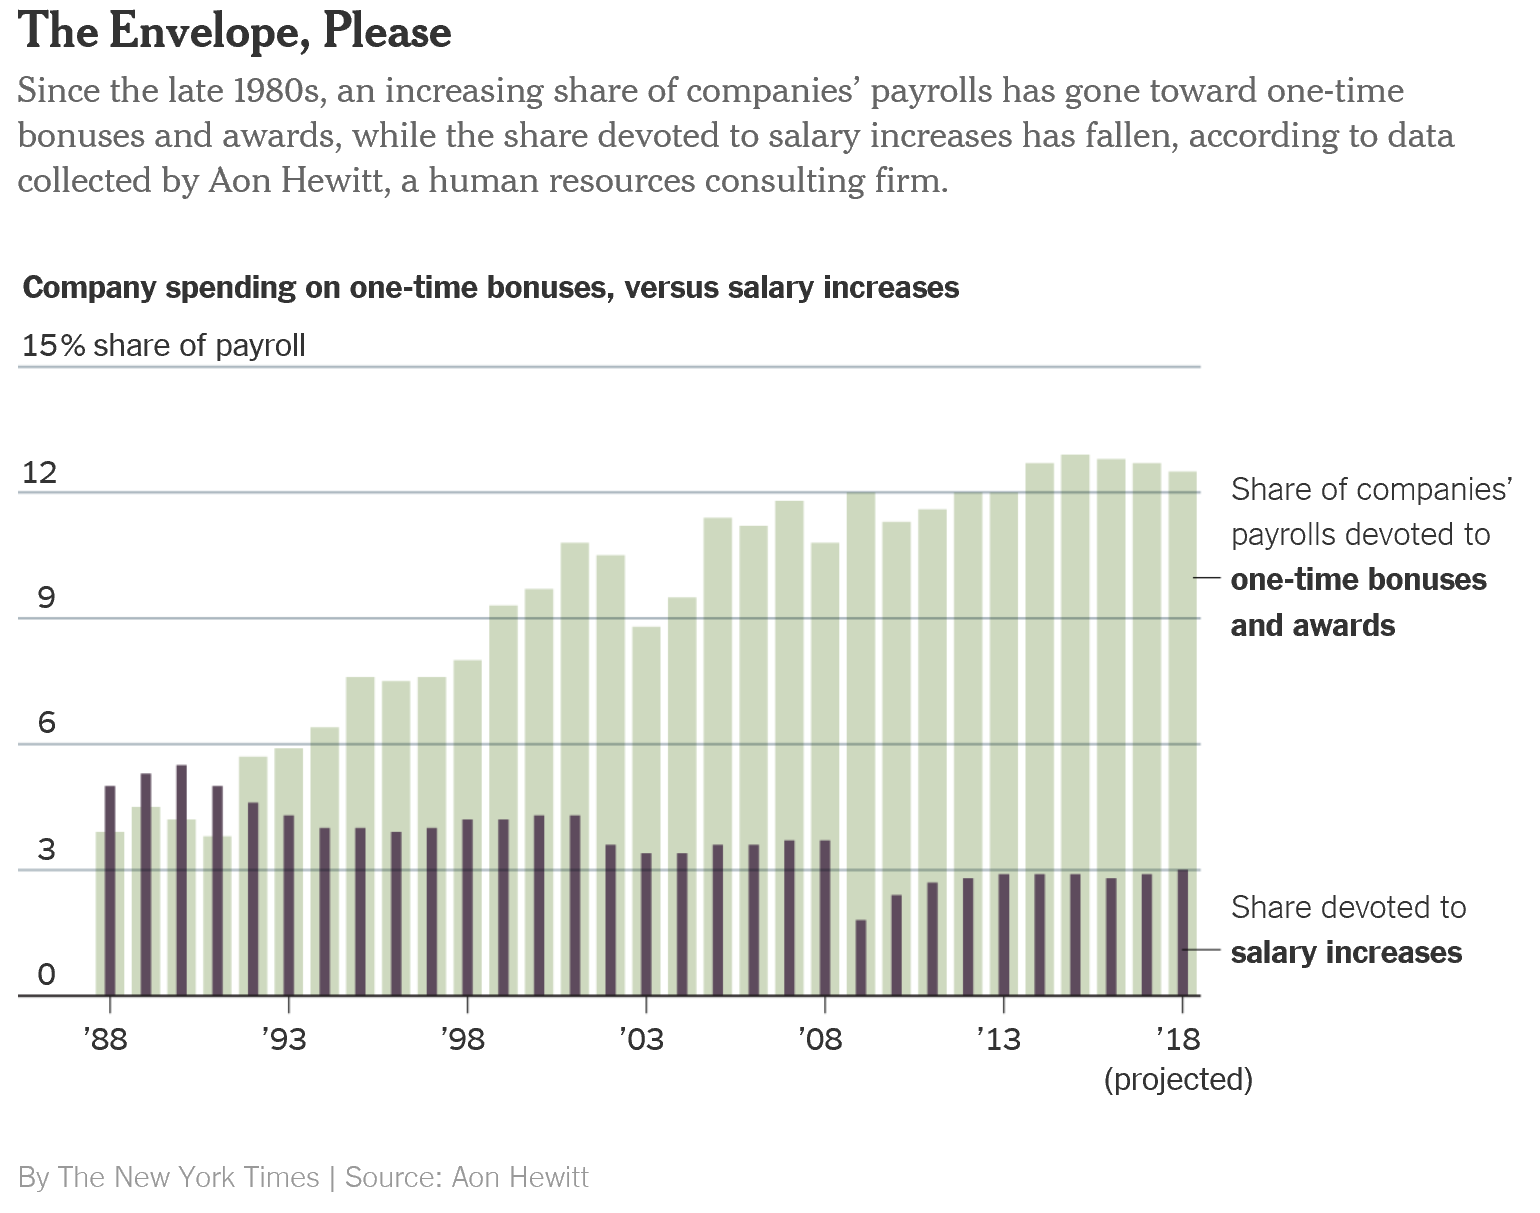
    Back in 1991, for example, variable pay (like one-time bonuses) took up about 3% of total compensation budgets, while the budget for annual salary increases was 5%.

    Fast forward to 2017 and the amount of budget allocated to one-time bonuses has risen to 12.7% while the amount earmarked for annual salary increases has fallen to 2.9% (the 'getting 3%'ed to death phenomenon).

    A closer look at the data shows that after taking an expected financial crisis/recession dive in 2008/2009, compensation budget allocations have not really recovered to their pre-recession levels, while the budget for one-time bonuses and awards has continued on a slow and steady climb. This makes sense for a few reasons. The harsh economic environment from the recession era is still on many CEO's minds, and the need to be more flexible and adaptable, (especially when it comes to employee compensation), has become standard operating procedure and many companies. E

    Given these recent tax cut bonuses play into that line of thinking - CEOs can't be sure these tax cuts will be permanent, a change in control or philosophy of Congress could alter the landscape at almost any time. Giving one-time bonuses instead of 'permanent' salary/wage increases allows companies to respond to market, competitive, and economic conditions in almost real-time, whereas granting (and potentially removing), salary/wage increases is a much more difficult challenge to manage. Have you ever known any worker who will accept a salary or wage cut cheerfully?

    But beyond that, companies still need to keep worker's desires in mind, after all the labor market remains extremely tight. The Times reports that a second Aon Hewitt survey showed that when asked what they wanted their companies to do with their tax cut windfall 65% of them said they wanted a pay raise, far more than other options like a bonus or an increase to the 401(K) contribution. Interesting stuff for sure.

    Compensation is a tough job for sure. And oddly, it doesn't get that much easier when there are more dollars to spread around.

    Have a great day! 

    Wednesday
    Feb072018

    UPDATE: On striking for a 28-hour work week

    A few seeks ago I shared the story of the largest metal and steel worker's union in Germany whose members were threatening to strike for the right (among other things) for the ability to reduce their work week to 28 hours per week for up to two years at a time - mainly in times where a worker has increased child or elder care responsibilities. As a reminder, this is what the steel workers were trying to accomplish:

    Workers have downed tools at more than 80 companies across Germany as the country’s biggest union stepped up its campaign for a 28-hour working week to allow employees to improve their work-life balance.

    In what is shaping up to be the biggest industrial dispute in the metalwork sector in three decades, more than 15,000 employees took part in warning strikes at factories including those of the carmaker Porsche.

    The IG Metall union, which represents around 3.9 million workers, wants every employee in the metal and electrical sector to have the option to reduce their working hours for a total period of two years, with the automatic right to return to full-time employment afterwards.

    In mid-January I offered the take that we shouldn't look at these worker's demands as another example of the 'soft' or laissez-faire approach to work that we in the US like to think is common in Europe, and let ourselves believe that these kinds of increased worker calls for more benefits (including fewer hours potentially), could not become an issue here eventually. Workers in all kinds of industries likely have more power than they are currently exercising.

    Fast forward about three weeks - how did it turn out in Germany?

    UPDATE - German metal workers union secures right to 28-hour work week.

    From the piece in Business Insider:

    A German industrial union has won its workers the right to work just 28 hours per week in a deal that could eventually impact almost 4 million people in the country.

    IG Metall, the biggest trade union in Germany for metal and engineering workers struck the deal which will allow staff to go down from 35 hours to 28 hours per week for as long as two years, in instances where they need to care for children, elderly, or sick relatives.

    The agreement between the union and industry impacts some major, global manufacturers like Porsche, Airbus, and Mercedes, and also includes a 4.3% pay rise for the workers. It is a pretty major win for the workers, who seem to have gotten just about everything they were looking for in the deal.

    Why does this matter, especially to US readers, in a time where unions and labor rights movements in general have been declining for ages?

    I would say to think about this deal, and why the workers were looking for it, as less of a 'union' issue and more of a work/life issue. One of the major benefits of the so-called 'gig' economy is the schedule control that most gig workers have. There is a tremendous amount of flexibility and even power that comes with being able to self-determine how many hours you will or can work in a given day or week or month. Some times you want/need to work more, and other times fewer hours. Especially when dealing with child, elder, or other personal responsibilities.

    This effort by the metal workers union is really an attempt to try and marry some of the best features of the 'regular' employee (steady pay, benefits, some level of security, commitment to one company), with the 'gig' worker economy, (flexibility, work/life balance, control and freedom).

    Gig working is not for everyone. It can be uncertain, scary, can have pretty major fluctuations in compensation and benefits. And 'regular' work also has its downsides - lack of schedule control, long hours, stress about work/life. So what the German metal workers are really trying to do is find a kind of compromise between the two - by crafting a design where they are still 'regular' employees, but have more flexibility to determine when they need to reduce (or increase) their working hours based on personal and family circumstances.

    That is the way to think about this story if you are a business or HR leader in the US or anywhere really - this is not about the union or some kind of Euro-socialist approach to work.

    It is about workers trying to find the 'right' kind of work/life balance and arrangement that fits for them in the modern world. And it is about companies trying to find ways to ensure their goals can also be met, knowing that for most of them, these goals can only be met through the success and well-being of their workforces.

    Have a great day!

    Monday
    Jan292018

    Knowing where to optimize your talent

    Over the weekend I caught this pretty interesting discussion on the Marginal Revolution site, 'Where is talent opimized?', a discussion of what industries (or more accurately job roles), have the ideal or 'best' talent suited for their roles actually doing those roles.

    It makes more sense to think about this idea of talent optimization, a state where the very best people who could perform a job are actually in that job by looking at a couple of examples where the difference is pretty clear. For example, professional basketball players, who are subject to years or training, competition, evaluation, and measurable performance metrics are probably the 'optimal' group of folks to actually be playing pro basketball. Said differently, it isn't likely there is a large untapped, undiscovered group of people who really should be playing pro basketball, but for some reason (or some labor market inefficiency), they are doing some other job instead.

    Compare that to a job like mid-level management or perhaps many governmental jobs. In many of these roles performance is harder to quantify and measure, compensation levels are either opaque or set on criteria other than performance, barriers to entry to the profession exist, (lots of 'referral' hiring for example), and finally many of these jobs have been closed off to under represented groups for a long time. When you think about it, it seems really unlikely that talent in these kinds of roles, in any organization, will be the 'best' or 'optimal'. It is just too hard to even figure out what 'optimal' even means I would argue. Finally, roles that once you 'get in' it is almost impossible to get removed from for poor performance or incompetence should also be added to this group of sub-optimized talent profiles.

    Why is this interesting (at least to me?)

    Because I think often while we know that some roles in the organization are more important/strategic to the organization than other roles, we don't always acknowledge that there also exists this difference in the ability to 'optimize' talent across different roles as well. Although the distinction may be subtle, these two are not actually the same thing.

    Finally, understanding how (or I suppose if), an organization can exploit these kinds of selection/sorting inefficiencies and get 'better' or more optimal talent attracted to roles that typically are less likely to be optimized, could result in a competitive advantage through talent that is usually unrealized.

    In other words, if your organization could truly have the 'best' front-line managers wouldn't that make a huge difference in business and talent outcomes?

    I will leave you with this one link to think about this more - In-N-Out Managers make $160,000 annually.

    Have a great week!

    Thursday
    Jan182018

    UPDATE: Amazon just told you the top 20 cities for business investment in North America

    Surely you heard about Amazon's announcement of their intentions to build a second company headquarters, the so-called HQ2, in the coming years, and the widely covered RFP process to help them identify candidates (cities and regions), for this new HQ2. I wrote about the process last October here.

    Over 238 cities submitted bids to become the home of HQ2, and this week, Amazon named a short list of 20 cities that have made it to the second round of consideration, where Amazon will work more closely with these cities to dive deeper into the proposals, to get additional information, and to winnow down the list to the eventual winner - the home of the new HQ2.

    This is a big deal for these 20 contenders - $5B in investments and as many as 50,000 high-paying jobs.

    Here's the list of cities that made the short list, as well as a map showing the 20 - more on that in a bit.

    Atlanta, GA
    Austin, TX 
    Boston, MA 
    Chicago, IL 
    Columbus, OH 
    Dallas, TX 
    Denver, CO 
    Indianapolis, IN 
    Los Angeles, CA 
    Miami, FL 
    Montgomery County, MD 
    Nashville, TN 
    Newark, NJ 
    New York City, NY 
    Northern Virginia, VA
    Philadelphia, PA 
    Pittsburgh, PA 
    Raleigh, NC 
    Toronto, ON 
    Washington DC 


    Kind of the 'usual suspects' list I suppose, but a couple of things stand out for me.

    One, nothing in the NorCal/Silicon Valley area. Probably a couple of reasons for this. Amazon has always seemed to indicate that it wanted more of a geographical balance between its current Seattle HQ and the eventual HQ2, pointing to a midwest or eastern location as a more likely selection. And two, I wonder if Amazon just wants no part of the already overheated market for talent, real estate, and inflated cost of living that comes with the Valley.

    Also, from the long list of 238, which certainly included a lot of places that had no real chance at meeting Amazon's requirements for population, talent availability, access to transportation hubs, etc., the final 20 does not include even one true 'outlier', a real longshot location that would have at least made things interesting, (if you are a betting person, anyway). Pretty much any of the 20 on the short list would seem reasonable should they eventually win the bid and become the home of HQ2.

    Finally, in case you or your leadership were wondering just what were the best locations in North America to consider a similar, major investment, well, Amazon might have done the first wave of analysis and due diligence for you. You can almost look at the Top 20 list from Amazon as a starting point and work from there. And believe me, even the 19 cities that don't win this bid will remind you and everyone that they were a finalist for one of the largest US corporate investment initiatives ever.

    And since everything is more fun when there is something on the line, I present Steve's opening odds for each of the 20 finalists to be named the home of the new HQ2.

    Atlanta, GA - 4/1
    Austin, TX - 5/1
    Boston, MA - 7/1
    Chicago, IL - 8/1
    Columbus, OH - 25/1
    Dallas, TX - 10/1
    Denver, CO - 12/1
    Indianapolis, IN - 20/1
    Los Angeles, CA - 15/1
    Miami, FL - 15/1
    Montgomery County, MD - 20/1
    Nashville, TN - 25/1
    Newark, NJ - 20/1
    New York City, NY - 10/1
    Northern Virginia, VA - 15/1
    Philadelphia, PA - 12/1
    Pittsburgh, PA - 12/1
    Raleigh, NC - 10/1
    Toronto, ON - 20/1
    Washington DC - 15/1


    Reminder: These odds are presented for entertainment purposes only, please, no wagering.

    Have a great day!

    Thursday
    Jan112018

    CHART OF THE DAY: The Changing Composition of the US Workforce

    There are only two websites you need. Actually three, if you count this one. And hint, none of them are Facebook. I promise you that one day you will regret all the time you wasted with Facebook. But I digress.

    One is BLS.gov, the Bureau of Labor Statistics site where all the employment, industry, productivity, time use, compensation (and more) information you need on the US labor force is located.

    The other is the Federal Reserve of St. Louis' fantastic FRED site, where you can download, graph, and track over 500,000 data series covering the economy, employment, demographics and much, much more. Data geeks like me can get lost in the FRED site for hours.

    I was using these two sources to update my notes and perspective on US aggregate employment across industry groups, useful information that helps me guide and shape the specific industry focus that results in both the content for this blog, topics for the HR Happy Hour Podcast, and the program for the HR Technology Conference.

    This data is also useful to consider in a larger sense - like when thinking about governmental policies and investments, the focus of secondary and higher education and training, and even when answering questions like 'Just what is our country good at?' from a business/economy perspective.

    Have a look at today's Chart of the Day - (built at the FRED site) aggregate US employment since 1980 in the largest category components of the labor force, then some comments from me..

    We all know that 100 - 120 years ago the US shifted from a largely agricultural economy/labor force to a manufacturing, shipping, and trading workforce. And then, slowly but surely, beginning in about 1980, a shift started to occur. Manufacturing employment began to decline while professional services, health care, and retail began to climb.

    Here's the snapshot of latest employment numbers for the categories in chart, (Nov 2017).

    Manufacturing, while pretty apparent to most casual labor market observers, has fallen below professional services, health care, leisure and hospitality, even retail employment in terms of its overall share of US employment. For some perspective, as of November 2017 total US non-farm employment was about 149 million. At that level, manufacturing now represents only about 8.5% of US employment.

    In terms of where most observers see these trends continuing out into the future, the aging US population seems to clearly indicate that health services and health care will be the largest growth area moving forward. Retail jobs are under threat from automation, online shopping (and the efficiencies and lower labor costs associated), and by the constant chase for less expensive goods produced and shipped in lower cost countries. The same threats also impact manufacturing. Even the largest, new manufacturing plants require far fewer workers than the ones of just 10 - 20 years ago.

    There's lots more to think about when looking at this data. I encourage anyone interested to join me in a deep dive on BLS.gov and the St. Louis FRED.