Quantcast
Subscribe!


Enter your email address:

Delivered by FeedBurner


E-mail Steve
This form does not yet contain any fields.

    free counters

    Twitter Feed

    Entries in data (149)

    Tuesday
    Jul152014

    CHART OF THE DAY: Unemployed workers per job opening

    The latest Job Openings and Labor Turnover Survey (JOLTS) was released last week by the Bureau of Labor Statistics and it showed that US job openings as of May 2014 stood at about 4.6 million, up from 4.5 million in April.

    Taking the JOLTS openings data and combining it with gross unemployment data (also from the BLS), and you get the chart below that shows the trend over time in the ratio of unemployed workers per job opening. Take a look at the chart, (from Business Insider) and then some comments from me below.
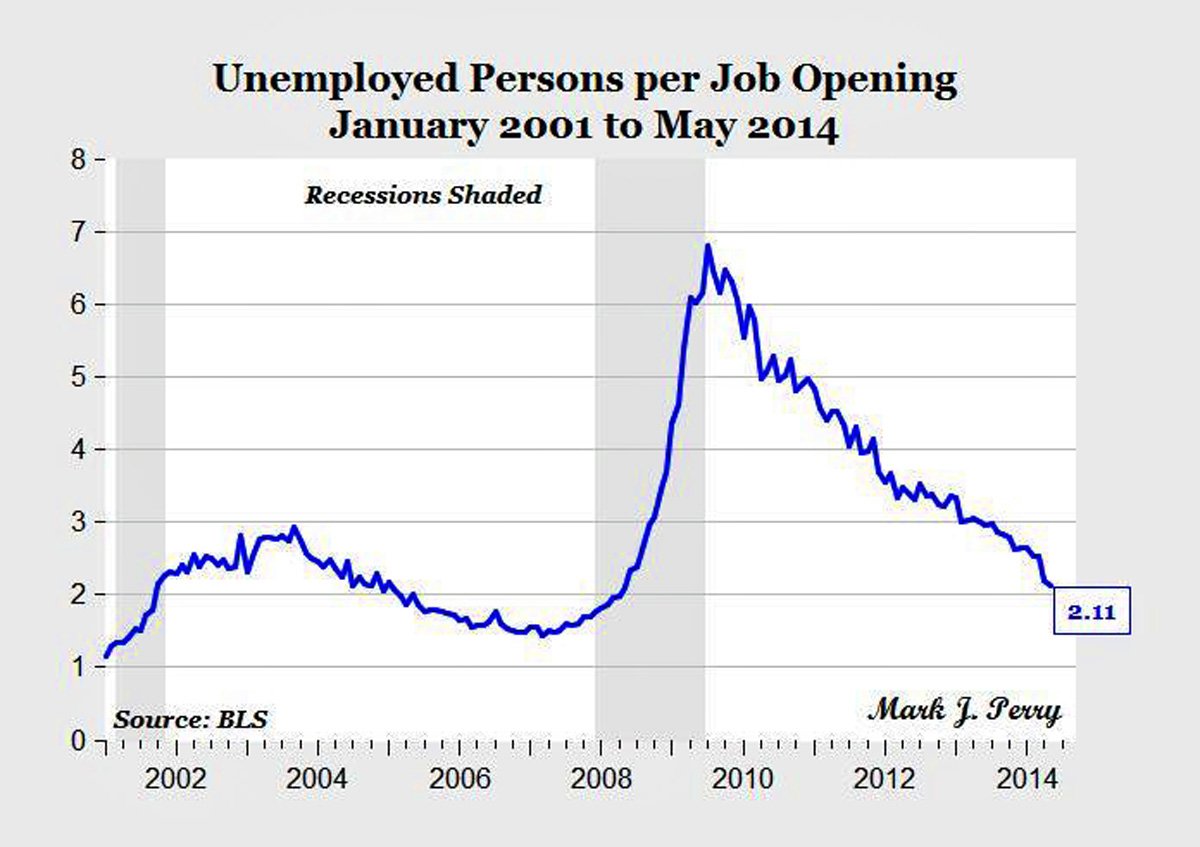
    1. The latest ratio of unemployed workers to job openings is 2.11, the lowest level since early 2008, and extremely lower than the post financial crisis high water mark of almost 7 in mid-2009. 

    2. The trend seems to suggest a continued lowering of this ratio, as increased hiring will likely be only partially offset by more entrants into the labor marker, (students leaving school, folks getting coaxed back into the labor market due to improving prospects).

    3. As an HR/talent pro, you might start finding for more jobs a relative reduction in the number of applicants for your open positions. Unless you are offering so-called 'good' jobs, have a compelling employer value proposition, or have a proven pipeline of candidates, there will be, at least in aggregate, fewer available people for your jobs. 

    4. As a consequence of this labor market tightening, your Econ 101 book will tell you that wages are going to have to begin rising more steeply. Again, this is what the economists predict, but for you, all Economics is local. If indeed you are finding it difficult to attract adequate numbers of qualified candidates, then you are going to have to take a long, hard look at the compensation you are offering for these roles. More and more categories of workers are going to at least perceive they have more leverage, (same goes for existing employees too).

    5. With fewer unemployed people per job in the labor pool, it is going to be paramount, even for many entry-level jobs, that you get better at identifying talent from competitors and companies in adjacent industries in order to maximize your candidate flow. It could be the days of simply posting a job online, or placing a Help Wanted sign in the window simply to get the candidates you need are disappearing.

    OK, that is it on this from me. What do you think, are you seeing the markets for your open jobs getting tighter?

    Tuesday
    Jul012014

    Three quick takes on the Facebook mood manipulation study

    By now you have certainly heard or read about Facebook's 2012 study in which researchers altered the messages and posts presented in about 700,000 users' newsfeeds in order to determine if seeing relatively more negatively or positively connotative posts would in fact make the user him or herself tend to post more negative or positive posts than they might otherwise.

    Turns out, that yes, seeing more positive or happy kinds of posts led users to post (to a small degree), more positive and happy updates themselves, while the inverse, with more negative posts in the feeds led to more negative updates than would have been expected.

    Here is a quote from the research paper that was published in the Proceedings of the National Academy of Sciences (PNAS).

    “When positive expressions were reduced, people produced fewer positive posts and more negative posts; when negative expressions were reduced, the opposite pattern occurred. These results indicate that emotions expressed by others on Facebook influence our own emotions, constituting experimental evidence for massive-scale contagion via social networks.”

    This study became news not so much for the findings themselves, (which seem kind of obvious), but for the expected and now kind of tired internet rage that accompanies every questionable move Facebook makes around privacy or related matters. How dare they manipulate the emotions and possibly the mental well-being of so many of its users in the name of a (kind of dopey) experiment? That kind of thing.

    So since I  A: Don't really use or care that much about Facebook to be emotionally invested in this, and B:  Need something other than the NBA or HR Tech to blog about occasionally, here are my (FREE) three quick takes on what this entire 'Facebook is using us for lab mice' kerfluffle should mean to you:

    1. You have been a lab mouse for years, you just like to forget this (or don't care). The instant Facebook began to tailor or select on your behalf the updates and posts it decided to display for you, (as opposed to a simple reverse chronological feed of all the updates from your friends and the pages you follow), you became a part of their little devious laboratory. In fact, you likely have no idea why Facebook shows you what it does, you just kind of accept it and move on. You miss probably hundreds of updates every week because Facebook has decided not to show them to you. You are already a mouse in their maze. 

    2. The business of Facebook is selling ads. The 'emotion' study, the hiding or promoting of items in your feed, the insane amount of times Facebook asks you for more information about you and your life are all for one (ultimate) purpose only - to better target you with 'relevant' ads. The more that FB can do to understand you, the longer it can keep you engaged and using the site, the more it can learn about you. And the more it knows about you the more about you it can package and sell to GM and Clorox and Microsoft. You get angry at FB for this little experiment because you have not yet made the leap to seeing them for what they are - a giant, publicly traded corporation that has to make its numbers every quarter. 

    3. You (probably) care too much about Facebook for this to matter to you. If this emotion study and the dozen other times FB has played fast and loose with privacy in the last few years really bothered you that much, you would simply opt out. But I bet 99% of the people that are reading this post have an active FB account. I do too. It doesn't mean that I agree with what they like to do with our data, but it also means that for whatever reason we keep giving them the benefit of the doubt, while silently acceding to their experiments and whims. We have allowed FB to become so important to our family lives or our businesses that we simply keep taking (and giving) whatever new change/experiment they care to dish out. I read 10 articles today expressing various levels of outrage over these 2012 experiments. I have not yet heard of anyone I know deleting their FB account.

    If you don't like the rules, then you have to start your own game, in your own sandbox. Until then... 

    Ok, I'm out. Be sure to 'like' this on Facebook. Maybe Marky Z. will make sure other happy people see that you did.

    Monday
    Jun302014

    CHART OF THE DAY: The Changing Age Pyramid

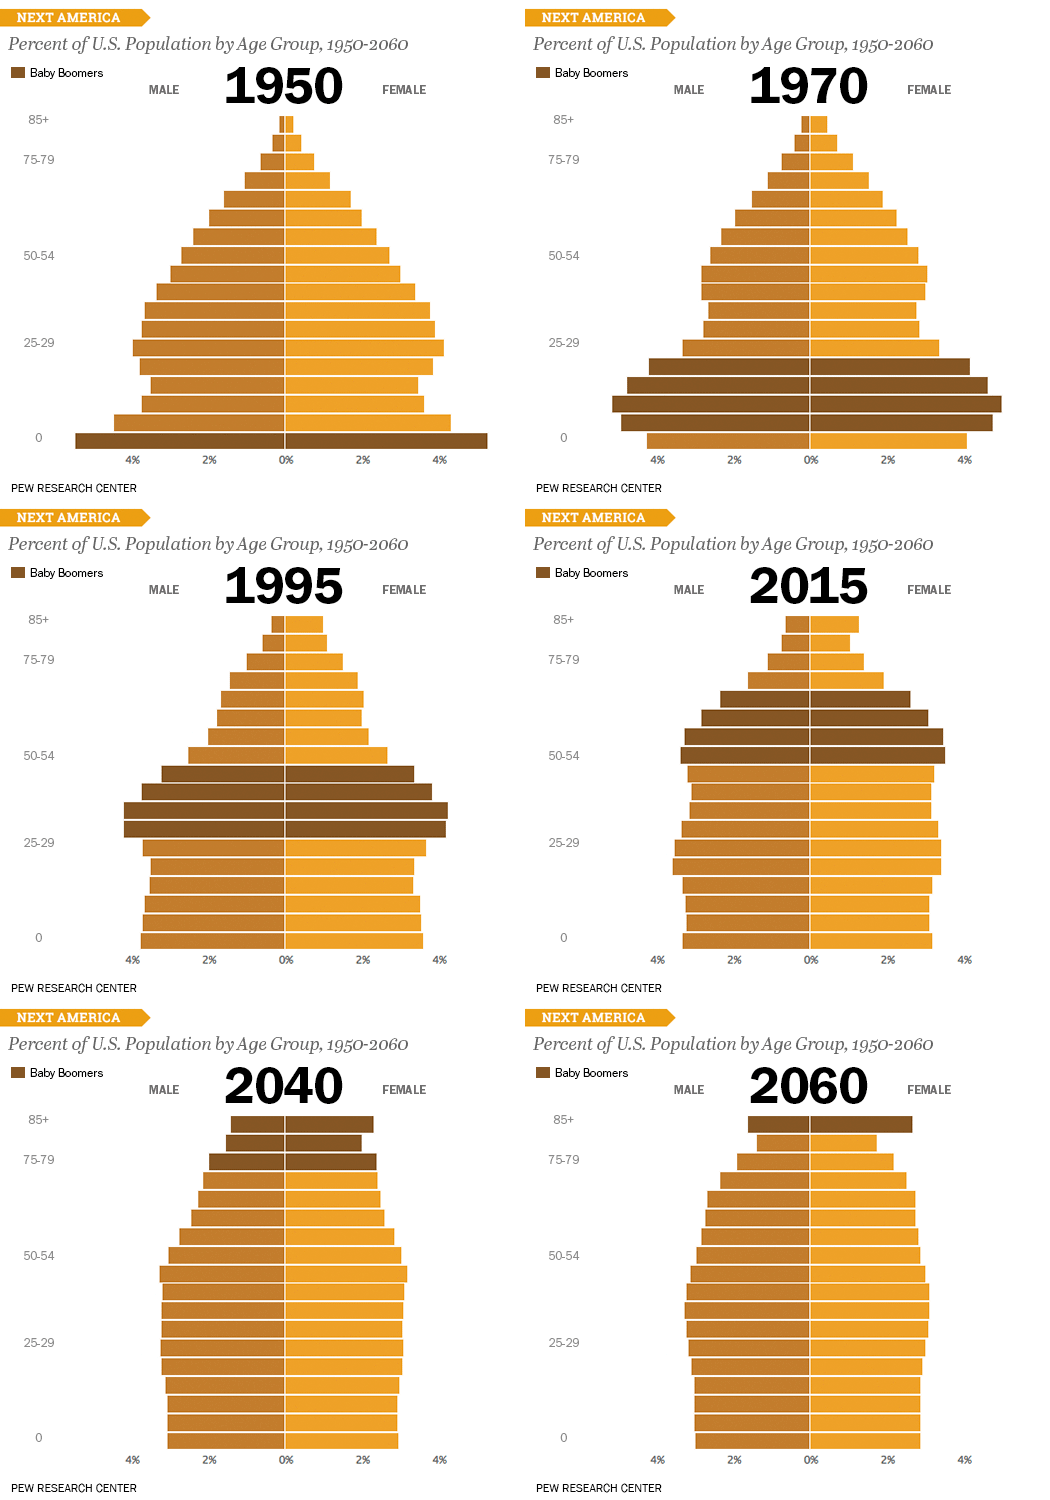
    I know I have posted a few times previously on the how the population in general is getting older on average, and how of course as an after-effect of this general trend we will begin (if we have not already), to see our workforce getting older as well. But risking overkill on the subject, I wanted to share a really cool GIF (a first for the CHART OF THE DAY here), on what this graying of the population looks like over time, courtesy of a cool visualization from The Atlantic.

    Take a look at the GIF below (try not to get dizzy), of the standard population pyramid that charts the percentage of a population by age group, and you can get a feel for how this aging trend is playing out. Of course as always, a few FREE comments from me after the chart. Email and RSS subscribers may need to click through.

    Pretty neat, right? And you can see in the darker colored rectangles moving up the chart the effects (and the size) of the Baby Boom generation that comes on to the scene in about 1950 or so, and over time climbs the population pyramid while fundamentally changing its shape from a classic pyramid with larger percentages of younger folks forming the base, into more of a rectangle.

    What are the most important workplace implications of an increasingly aging population?

    1. The obvious one - we will have more older workers in our organizations than in the past. This will be not just because people will want or will have to work later in life than in the past, it will be a matter of necessity, as the available candidate pools for jobs will age right in step with the general population. HR pros and recruiters will have to look at say 50+ year-old candidates with a different perspective. These folks might typically have 10-15 more working years left than a similar candidate would have in the recent past.

    2. Work and workplaces will have to adapt to more older workers. That could mean redesigning work stations and processes to make them more older-worker friendly, modifying work schedules to accommodate some older workers need or desire for lighter schedules, and taking a more thoughtful approach to things like benefits programs and design to better meet older workers expectations. It seems likely that the more successful organizations will not just recognize this trend, they will make strategic decisions to better position themselves to thrive in this new paradigm.

    3. Increased rate of retirements. Although many older people will continue to work later in life, of course many will not, and most organizations can expect to see a rise in the rate of retirements as the baby boom finally begins exiting the workforce en masse in the next few years. This is kind of the most basic or first step in any workforce planning exercise, and if you have not already taken a look at the important functional areas, important skill sets, and localized regions of your workforce and taken an initial estimate of replacement needs due to anticipated increased retirements, then you probably need to start that project today. For many skills and locations, an uptick in retirements combined with a shallow candidate pool will place a strain on your ability to keep staff at needed/desired levels to meet your business objectives.

    That's it - I'm out. Thanks for playing along with the Chart of the Day on a Monday.

    Have a great week!

    Friday
    Jun272014

    TOP HR DATA PLAY: Kill the FTE

    I had a fun time riding shotgun to Kris Dunn yesterday on the Fistful of Talent Webinar titledHR Moneyball:  The FOT Bootstrapper Guide To Getting Started With Big Data, in which KD and I took a look at some the ways that HR/Talent pros can use Big Data and Business Intelligence approaches to raise their games and drive the adoption of so-called 'Data-driven HR' in their organizations.

    Of the five 'Big Data' plays in the FOT playbook, I think the one that I dig the most was #3, an idea called 'Salary Cap Utilization'. The basic idea is this - take a play from the world of sports leagues like the NBA and NFL that force teams to operate under a set of rules that govern maximum total player compensation, (the 'Cap'), and apply it inside your organization.

    I know what you are saying, that we already do that, it's called the Annual Salary Budget. We've been managing compensation that way forever. Each budget holding group or manager is allotted 'X' amount of dollars he/she can 'spend' on total comp for the year and they (probably subject to a dozen other HR rules around increase percentages, salary bands, etc.), have to sort out how that salary budget is allocated among their staffs.

    But chances are you are placing an additional, and probably unnecessary constraint on your managers as well - something called the full-time equivalent (FTE) budget.

    The FTE budget tells managers that in addition to the maximum amount of $$ you can spend on comp (The Salary Cap), there is some (kind of arbitrary) maximum number of headcount that you can spend your Salary Cap on, i.e., the FTE budget.

    When I first moved into an HR role, managing the HR systems at a mid-sized company, and first encountered the acronym FTE, I had to ask someone to explain it to me, as I had never seen it before. It seemed like a made-up kind of a construct, especially when you have to spend time breaking down and trying to convert worker schedules into their 'full-time' equivalents. And what, really, is 'full-time' anyway? That too, is kind of an arbitrary measurement to some degree.

    But $$ are not arbitrary and are not subject to interpretation or manipulation. Everyone understands what a dollar-based budget means.

    What are the advantages of dropping the FTE budget/constraint from your playbook?

    1. It gives leaders/managers more autonomy on how they allocate compensation across teams. Instead of operating under the dual constraints of 'heads' and $$, they simply have to make it work within the Cap. Need to makes some big changes to reinvent their department? Make it work under the Cap. Want to expand into something new? What can you give up to stay within the Cap? Have 5 all-star, 'A' players that need to get paid or they will walk out the door? Then pay them, just be ready to make the cuts elsewhere to remain within the Cap. 

    2. It forces the organization to be more flexible. The overwhelming tendency in an FTE-influenced budgeting scheme is for managers to guard 'their' FTEs like grim death. Have a position sit open or vacant for too long and managers will scramble to fill it with just about anyone, just so they don't 'lose' that precious FTE in the next budgeting cycle. Have a solid employee that wants to transfer out to a role in a different department? A role  that might better suit their skills and enhance their career development? Better be willing to give up an FTE buddy to make that happen.

    3. It allows HR pros to be more consultative and progressive when talking about things like merit increases, equity increases, offers above salary band maximums, counter-offers, retention bonuses, and most everything related to comp. Remove that FTE constraint and now more of the comp game is open for discussion and adaptation. HR is working with the business around what is important to the business - the relative cost of performance and how to get the most production from available resources. HR can now be in the game of reporting/advising on Salary Cap Utilization instead of counting up heads, something that in most instances does not really matter.

    We had a few other Big Data plays that we shared in the Webinar that were pretty neat as well (Hiring Manager batting average, turnover prediction, Health Care claims per capita), but for me eliminating the FTE might be the simplest and easiest one to get started with. 

    Have a great weekend!

    Thursday
    Jun122014

    CHART OF THE DAY: The slow-to-empty nest

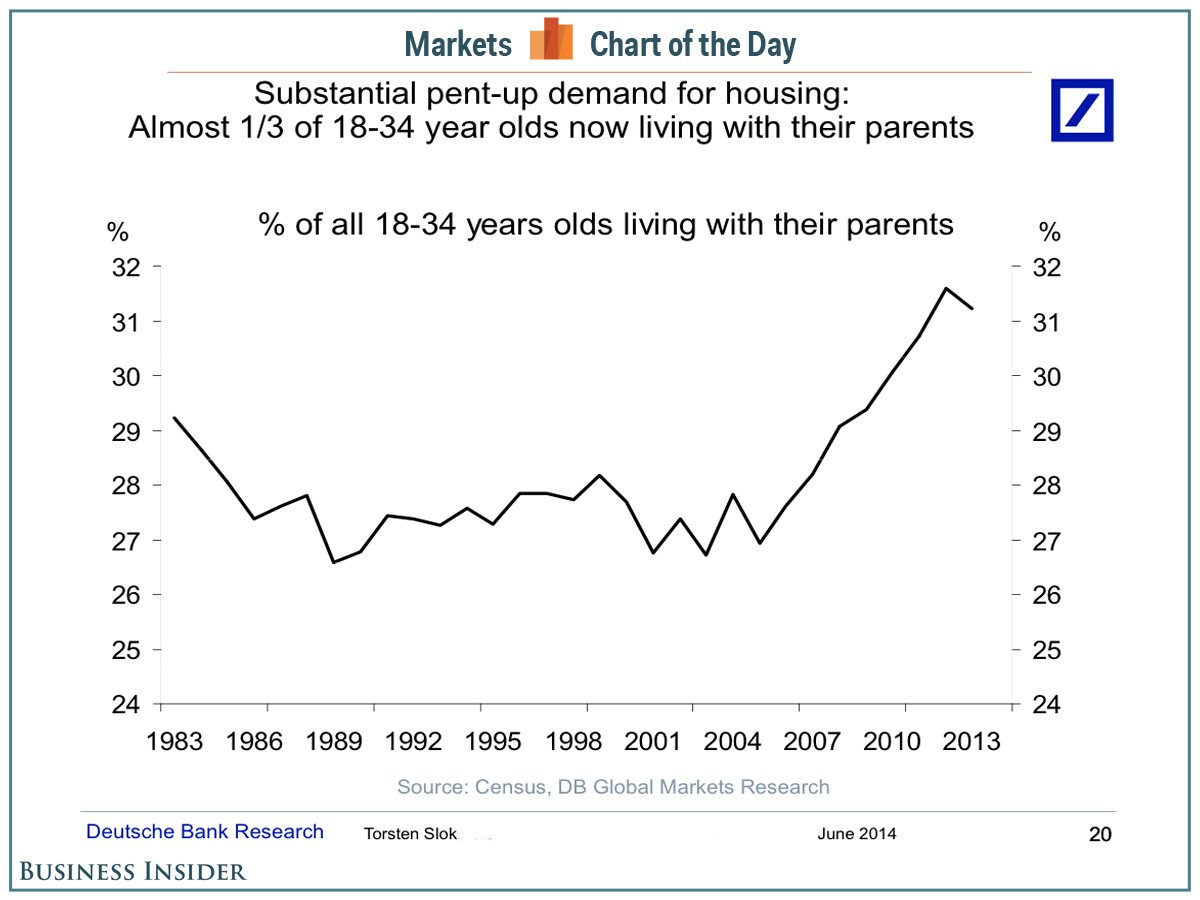
    Super chart on the increasing percentage of young adults that remain living with their parents/families, (courtesy of Business Insider) that I wanted to share here on the blog, and then offer up a couple of comments/observations on the data.

    First the chart:

    Sort of makes sense, right? Probably from both an observational and anecdotal perspective - we all know some 27 year old slacker still living in the parent's basement - and from a macroeconomic one as well. The lingering effects of the recession has made it tougher for many young adults to find jobs that pay well enough to allow them to strike out on their own. Combined with the consistent rise in college attendance, (needed in order to even try and find one of those elusive jobs), we now have more and more "kids" still living at home than we did even a few years earlier.

    What might this trend mean for HR/Talent pros?

    I can think of one thing for sure - the willingness for younger workers to switch jobs for even small reasons - a minor bump up in compensation or a slightly better working location. When you are not encumbered having to cover your own monthly mortgage or rent, and just have to maybe toss Mom and Dad a few bucks every week to keep the fridge stocked with Mountain Dew, then you are not really tied down by much of anything, including your job.

    On the flip side though, that situation provides opportunity for HR and recruiters looking to poach those kinds of younger workers themselves. No house, no mortgage, no big set of monthly bills and trips to the Home Depot = someone more able to take off on short notice and take a new job, maybe even one in another state or country.

    Mom and Dad could be totally enabling these kids, and perhaps that is not a good thing, but then again, a generation of more flexible, mobile, and recruitable workers could mean good news for you as an HR/Talent pro.

    Have a great day!