Quantcast
Subscribe!


Enter your email address:

Delivered by FeedBurner


E-mail Steve
This form does not yet contain any fields.

    free counters

    Twitter Feed

    Entries in data (149)

    Monday
    Feb032014

    CHART OF THE DAY: Where the new jobs are projected to be

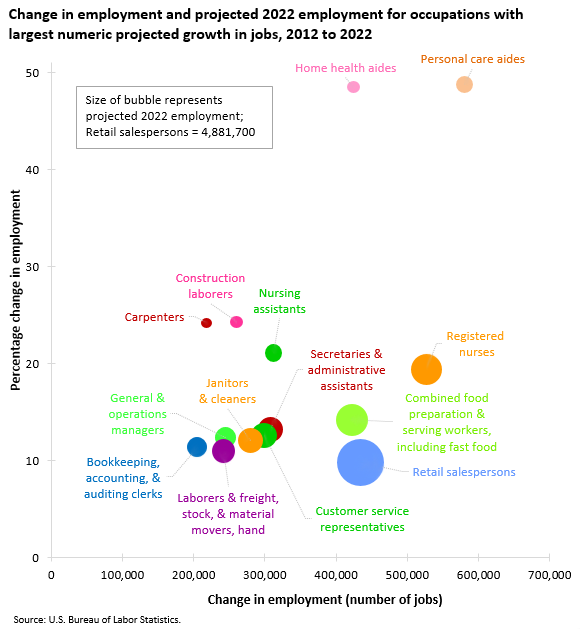
    Once again from our friends at the Bureau of Labor Statistics, today's chart is all about jobs - more specifically a look at in which occupations the BLS is forecasting the greatest numerical growth in jobs for the ten-year period of measurement, 2012 - 2022.

    Take a look at the chart, then (of course) a few comments from me afterward:

    Digging in to the data a little bit more (and taking into account the sheer difficultly in making these kind of far out into the future sorts of projections), reveals both some warnings, and some surprises.

    First off, something that is not surprising, is that of the 30 areas projected to experience the largest employment increases, 5 are in healthcare, including 3 of the top 4 jobs that are expected to see the greatest increase, (personal care aides, registered nurses, and home health aides).

    Combined, the top 5 healthcare related occupations are projected to add 1.6 million jobs over the 2012–2022 decade. 

    But while the growth in healthcare jobs is not surprising, given the pressures being put on the healthcare system due primarily to an aging population, what is surprising is what the BLS suggests about the educational attainment needed by workers desiring to actually work in these faster-growing occupations.

    From the BLS sumary:

    Two-thirds of the occupations projected to add the most new jobs typically require a high school diploma or less, while only five typically require a bachelor’s degree.

    Now that little observation is, to me at least, a little surprising, or perhaps just a little misaligned with everything that we typically see about the importance of higher education as it relates to a candidate's job prospects. But upon closer examination of the BLS job growth projections, perhaps we should not be that shocked at all. 

    The care aides kinds of jobs, the retail jobs, the food prep and serving jobs, the customer service reps, (all in the Top 10 list of 'growth' occupations), well none of these require (typically), much if any higher education and of course, also typically offer relatively lower wages than the kinds of jobs of the future we like to think about, (like coding apps, designing wearable computers, or working in high finance).

    Yep, according to the BLS anyway, job growth to 2022 is going to be mostly about low-skilled, low-wage, low prospects kinds of service jobs.

    Actually the easiest kinds of jobs for the robots to take.

    Happy Monday.

    Wednesday
    Jan152014

    CHART OF THE DAY: The Labor Force in 2022

    ...will be older, (relatively smaller), more non-white, and will certainly have more robot participation...

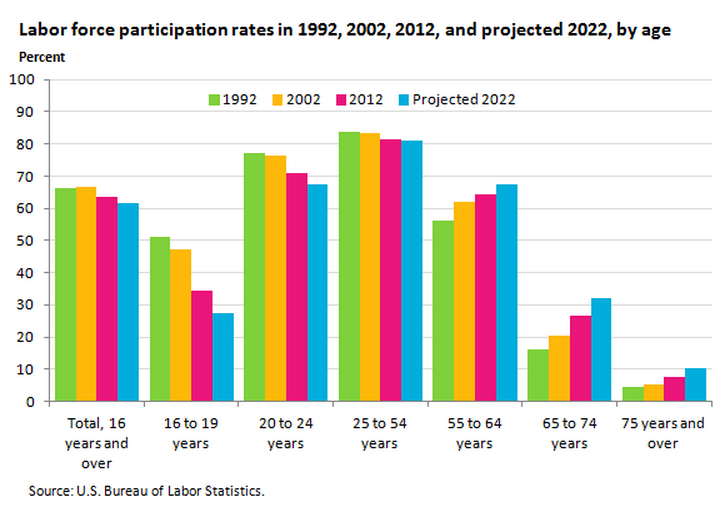
    First, here is the chart, courtesy of our friends at the Bureau of Labor Statistics:

    And below are the key findings from the aggregate data presented in the chart above, as well as in the details on gender, ethnicity, and sub-age group data (all found from the BLS in a piece titled "Labor force projections to 2022: the labor force participation rate continues to fall").

    The Bureau of Labor Statistics (BLS) projects that the next 10 years will bring about an aging labor force that is growing slowly, a declining overall labor force participation rate, and more diversity in the racial and ethnic composition of the labor force.

    The labor force participation rate increased in the 1970s, 1980s, and 1990s and reached an all-time high during the 1997–2000 period. The rate declined during and after the 2001 recession before stabilizing from 2004 to 2008. The labor force participation rate fell in 2009 and continued to fall after the 2007–2009 recession ended. As the baby-boom generation ages and begins to retire, BLS projects that the overall labor force participation rate will continue to decline to 2022.

    During the 2012–2022 period, the growth of the labor force is anticipated to be due entirely to population growth, as the overall labor force participation rate is expected to decrease from 63.7 percent in 2012 to 61.6 percent in 2022.

    There is lots more in the details from the BLS piece, but I think you get the gist. And if you have been following this trend for any amount of time, you are probably not really surprised by the data.

    What is surprising, at least to me, is that whenever a new monthly employment report is released by the DOL that the talking heads on the business news continue to lament the low (and declining) labor participation rates, and speculate on the reasons why and the potential policies that could reverse this trend.

    If these 2022 projections from the BLS are accurate, or even close, I wonder if it makes more sense to quit trying to bring back the days of 2000 or so, and instead focus on what a smaller, more diverse, and older labor force means to our organizations and our economy.

    No fiscal program is going to turn back the clock for all the aging boomers. And hardly any feasible rise in the minimum wage is going to convince more 16 - 24 year olds that they would be better off working more and going to school less.

    The only age groups where participation is increasing are 55+.

    Keep that in mind this year as you are working on your 5 - 10 year business plans.

    Happy Wednesday.

    Tuesday
    Jan142014

    The downside of measuring everything

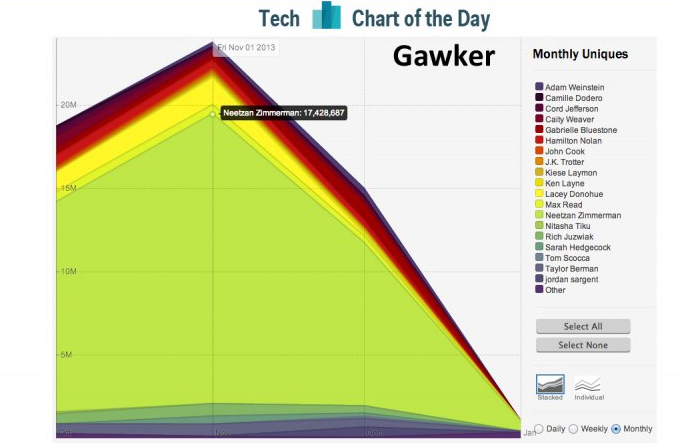
    KD had a great post on HR Capitalist about the (potential) link between pay and performance at Gawker media, as evidenced by the below chart that showed that one writer, Neetzan Zimmerman, (his traffic is in light green on the chart) on the staff of 15 or 16 was responsible for 99% of the site's overall traffic, (and revenue, or at least the opportunity to earn revenue).

    KD, rightly, concluded that this situation likely presented Gawker a huge and obvious 'Pay for Performance' situation, where if Gawker were truly taking the capitalist/meritocratist approach to business and talent management, they would have dropped about a third of the staff, allocated all that salary budget to Zimmerman, and told the remaining nine or so staff to shut up, (while showing them the traffic chart), if they didn't like being paid about 20% of what Zimmerman was getting.

    While we don't know what Gawker actually did, we do know that Zimmerman left to chase something else, so at least it seems on the surface a gigantic rise in salary or performance related comp was not on offer.

    But rather than talk about what Gawker should have done, (or do in the future with their comp/performance strategy), I'd rather think a little about a world where having the access to data and the analytical tools to actually do more data-informed performance becomes more and more prevalent.

    One of the most common reasons true pay for performance isn't done, or isn't done successfully, is that it just is really hard to accurately and fairly quantify and measure performance in the first place.  Unlike the staff of writers at Gawker, who can be reasonably and pretty fairly judged on their performance by web traffic to the site for their articles, which is both easy to measure and not subject to the whims of any manager's opinion or rating biases, most of the rest of us have jobs perhaps a little more complex, variable, and nuanced.

    The kinds of jobs that don't allow easy and clean measurement, and consequently don't facilitate easy comparison of workers within and across work groups. So we invent things like competency models, and core job functions, and 360s, and talent reviews and calibration in order to come up with some kind of repeatable, reasonable, and defensible method to rate and review folks. And after all that the difference between the annual salary increases for the 'best' performers and the average performers might be a percent or two. 

    But going forward driven by the amazing technological advances that are on the horizon we will live in a new world of increased connectivity, improved capability to capture data about the effectiveness of previously untraceable things from a new and improved set of wearable devices, company-issued apps or smartphones that will both broadcast and track our every move, and the nascent internet of things that will provide data on our interactions with machines, (and how fast and effectively we respond to their needs). 

    Yep, in the (near enough) future almost all kinds of jobs and the relative performance of the people doing those jobs will be measurable. We will be able to measure everyone. Everything that they do. All the time.

    Man that will be great.

    <You had better get back to work now. Trust me.>

    Thursday
    Jan022014

    REPRISE: Happiness and HR Data - Coming to a Delivery Truck Near You

    Note: The blog is taking some well-deserved rest for the next two weeks (that is code for I am pretty much out of decent ideas, and I doubt most folks are spending their holidays reading blogs anyway), and will be re-running some of best, or at least most interesting posts from 2013. Maybe you missed these the first time around or maybe you didn't really miss them, but either way they are presented for your consideration. Thanks to everyone who stopped by in 2013!

    If 2013 was the year of Robots and Automation, then the first runner up for topic of the year would probably have been Data and Analytics. The below post was my personal favorite example of the topic and what the future (the near future I bet) will hold for how data about people will be combined with data about machines and mashed up with process design in order to drive business outcomes. The piece originally ran in August 2013.
    ----------------------------------------------------------------------------------


    Happiness and HR Data - Coming to a Delivery Truck Near You

    Sometimes in all the conversation in the HR/talent space about the increased use of data, Big Data, and workforce analytics by HR leaders and organizations that practical, innovative (and possibly somewhat creepy), examples of how all this data coupled with better tools to understand it all are sometimes hard to find. Or hard to understand. Or not really specific enough that they resonate with many HR and Talent pros.

    Lots of the articles and analysis about data and analytics for HR end up reading more like, 'This is going to be important', or 'This is going to be extremely important and you are not ready for it', or even 'This is going to be extremely important, you are not ready for it, but I (or my company) is ready to help you sort it out.'

    Fortunately for you, this is not one of those kind of articles.

    Over the weekend I read a long-ish piece called Unhappy Truckers and Other Algorithmic Problems on the Nautilus site, that provides one of the most interesting and practical examples of how a better understanding of HR data, (among other things), is helping transportation companies plan routes, assign work, and execute managerial interventions, often before they are even needed.

    At the core of most transportation and delivery problems is essentially a logistics challenge as the 'Traveling Salesman' problem.  Given a fixed time period, say a day or an 8-Hour shift, and set number of destinations to visit to make sales calls, how then should the traveling salesman plan his route for the maximum efficiency. 

    For a salesperson making four or five stops in a day the problem is usually not that hard to solve, but for say a UPS or FedEx delivery truck driver who may have as many as 150 stops in a day - well that problem of math and logistics gets much, much more complex.  And, as the piece from Nautilus describes, the Traveling Salesman problem is not only incredibly important for transportation companies to try and solve, it becomes even more complex when we factor in the the delivery drivers are actual human beings, and not just parts of an equation on a whiteboard.

    Check out this excerpt from the piece to see how one (unnamed) delivery company is taking HR and workforce data, couples with the realization that indeed, people are a key element,  and baking it in to the classic math problem of the Traveling Salesman:

    People are also emotional, and it turns out an unhappy truck driver can be trouble. Modern routing models incorporate whether a truck driver is happy or not—something he may not know about himself. For example, one major trucking company that declined to be named does “predictive analysis” on when drivers are at greater risk of being involved in a crash. Not only does the company have information on how the truck is being driven—speeding, hard-braking events, rapid lane changes—but on the life of the driver. “We actually have built into the model a number of indicators that could be surrogates for dissatisfaction,” said one employee familiar with the program.

    This could be a change in a driver’s take-home pay, a life event like a death in the family or divorce, or something as subtle as a driver whose morning start time has been suddenly changed. The analysis takes into account everything the company’s engineers can think of, and then teases out which factors seem correlated to accident risk. Drivers who appear to be at highest risk are flagged. Then there are programs in place to ensure the driver’s manager will talk to a flagged driver.

    In other words, the traveling salesman problem grows considerably more complex when you actually have to think about the happiness of the salesman. And, not only do you have to know when he’s unhappy, you have to know if your model might make him unhappy. Warren Powell, director of the Castle Laboratory at Princeton University’s Department of Operations Research and Financial Engineering, has optimized transportation companies from Netjets to Burlington Northern. He recalls how, at Yellow Freight company, “we were doing things with drivers—they said, you just can’t do that.” There were union rules, there was industry practice. Tractors can be stored anywhere, humans like to go home at night. “I said we’re going to need a file with 2,000 rules. Trucks are simple; drivers are complicated."

    Did you catch all the HR/talent/workforce data baked into the model described above?

    Payroll, time and attendance, life events that likely would show up in the benefits admin system, scheduling are all mentioned, and I bet digging deeper into the model we'd find even more 'talent' elements like supervisor or location changes, time since a driver's last compensation increase, and maybe even 'softer' items like participation in company events or number of unread emails in their inbox.

    The specifics of what bits of talent data aere being incorporated into the process matter less than the fact that in the example the HR data is being mashed up so to speak with the 'hard' data from the truck itself (which is another interesting story as well), and analyzed against past driver experiences to alert managers as to when and where an accident is more likely to occur.

    There is even more to the problem than the technical observations from the truck itself, and the alogorithms' assessment of the HR/Talent data - things like Union rules and contracts factor into the equation as well. 

    But for me, this example of taking HR data and using it not just to try and 'predict' HR events like involuntary turnover or a better or worse performance review score, and apply it to real business outcomes, (the likelihood of accidents) represents a great example of where 'Big Data for HR' is heading.

    I definitely recommend taking a few minutes this week to read the entire piece on the Nautilus site, and then think about some the next time the FedEx driver turns up with a package.
    Thursday
    Dec262013

    REPRISE: If Yahoo doesn't kill remote working, then Big Data will

    Note: The blog is taking some well-deserved rest for the next two weeks (that is code for I am pretty much out of decent ideas, and I doubt most folks are spending their holidays reading blogs anyway), and will be re-running some of best, or at least most interesting posts from 2013. Maybe you missed these the first time around or maybe you didn't really miss them, but either way they are presented for your consideration. Thanks to everyone who stopped by in 2013!

    The below post hits on a couple of topics that were beaten to death in the HR blogosphere in 2013 - the talent management decisions at Yahoo! and what technology and Big Data will mean for work and workplaces. The piece originally ran in March 2013.

    ----------------------------------------------------------------------------------

    If Yahoo doesn't kill remote working, then Big Data will

    A little bit lost in the continuing fallout from the decisions by Yahoo to end remote working arrangements for their staff, and Best Buy's move to end ROWE (Results Only Work Environment), at its corporate headquarters was this much more interesting, (and potentially more important), report in the Wall Street Journal, 'Tracking Sensors Invade the Workplace', that hints at a data-powered future workplace where 'being physically together' is not just mandated, but is tracked, recorded, and interpreted by algorithms and leveraged by management.

    How exactly does Big Data, (which usually sounds kind of benign, or at least non-threatening), play a role in the future of telework?  Take a look at this excerpt from the WSJ piece:

    As Big Data becomes a fixture of office life, companies are turning to tracking devices to gather real-time information on how teams of employees work and interact. Sensors, worn on lanyards or placed on office furniture, record how often staffers get up from their desks, consult other teams and hold meetings.

    Businesses say the data offer otherwise hard-to-glean insights about how workers do their jobs, and are using the information to make changes large and small, ranging from the timing of coffee breaks to how work groups are composed, to spur collaboration and productivity.

    "Surveys measure a point in time—what's happening right now with my emotions. [Sensors] measure actual behavior in an objective way,"

    The next step in figuring out how people work, communicate, and interact in the workplace and with their colleagues involves wearing an always-on tracking device, (bathroom breaks optional), and harnessing all the data the device collects about who a worker talks to and for how long, how often they get up, when they hit the coffee room and vending machine, how long they stand waiting outside a conference room because the prior meeting ran long - all of this and more.  Mash up that 'experience' data with other electronic data trails (email, IM, internal collaboration tools, etc.), and boom - the data will be able to prescribe optimal amounts of employee interaction, recommend the timing and duration of breaks, send push notifications alerting you that the guy you need to connect with about the Penske account is two stalls away from you, and crucially - keep your managers informed about just what the heck you are up to all day.

    But it seems really likely to me that if these workplace tracking sensors gain more well, traction, that organizations will quickly realize that the only way to really exploit them, and the data they collect to its fullest potential, will be in a traditional workplace environment - with all employees together in a physical location and 'on-duty' at the same time. Let's face it, for a remote worker wearing a tracking sensor probably won't produce much valuable data - unless its to try to 'prove' to a suspicious manager that a remote worker is slacking off.

    The tracking sensors, if they catch on, will change the anti-telework argument from 'We need you to come in to the office so we can keep an eye on you' to 'We need you to come in to the office so we can track everything you do, say, touch, and feel all day.'

    It's a brave new world out there my friends...