Quantcast
Subscribe!


Enter your email address:

Delivered by FeedBurner


E-mail Steve
This form does not yet contain any fields.

    free counters

    Twitter Feed

    Entries in data (149)

    Thursday
    Sep262013

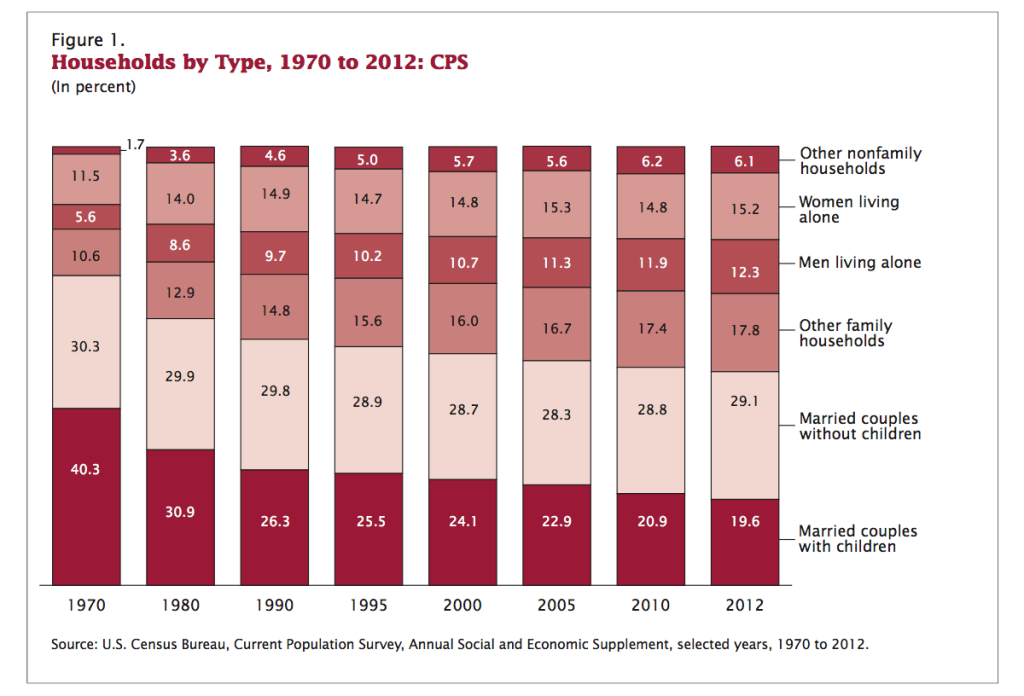
    CHART OF THE DAY: American Household Trends

    Spotted this beauty on the Big Picture site a couple of days ago - a look at how the composition of American households has changed, kind of dramatically, over the last 40+ years.

    Have a look:

    Of course you spotted the major changes since 1970 - the percentage of households consisting of 'traditional' families, i.e.. married couples with children has fallen by over half. 

    What has grown pretty significantly over that time, (and for many readers of this blog, and me too is our lifetimes), are 'non-traditional' households and people of both genders who are living alone.

    And taking a couple of these household categorizations and combining them we see that in 1970 about 70% of all households included a married couple, but by 2012 that number fell to 49%.

    Americans are getting married, (or staying married) less, living alone more, and have by a wide, wide margin moved away from what are now fast becoming antiquated ideas about what the traditional American family and household is.

    Why post this kind of data on the blog you might be asking? 

    I don't know, maybe because I find it interesting, (which is pretty much the only reason anything gets posted on the blog).

    And maybe because I do think it is important to think about what is going on at a macro level sometimes as these trends and new realities do impact our organizations, the people we employ, their challenges and needs, and how HR will be done in the future.

    What do you think? Does it matter to your organization that America has changed so dramatically in the last few decades?

    Happy Thursday.

    Monday
    Aug052013

    Happiness and HR Data - Coming to a delivery truck near you

    Sometimes in all the conversation in the HR/talent space about the increased use of data, Big Data, and workforce analytics by HR leaders and organizations that practical, innovative (and possibly somewhat creepy), examples of how all this data coupled with better tools to understand it all are sometimes hard to find. Or hard to understand. Or not really specific enough that they resonate with many HR and Talent pros.

    Lots of the articles and analysis about data and analytics for HR end up reading more like, 'This is going to be important', or 'This is going to be extremely important and you are not ready for it', or even 'This is going to be extremely important, you are not ready for it, but I (or my company) is ready to help you sort it out.'
    Fortunately for you, this is not one of those kind of articles.

    Over the weekend I read a long-ish piece called Unhappy Truckers and Other Algorithmic Problems on the Nautilus site, that provides one of the most interesting and practical examples of how a better understanding of HR data, (among other things), is helping transportation companies plan routes, assign work, and execute managerial interventions, often before they are even needed.

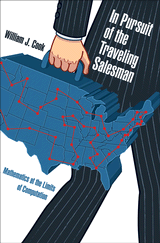
    At the core of most transportation and delivery problems is essentially a logistics challenge as the 'Traveling Salesman' problem.  Given a fixed time period, say a day or an 8-Hour shift, and set number of destinations to visit to make sales calls, how then should the traveling salesman plan his route for the maximum efficiency. 

    For a salesperson making four or five stops in a day the problem is usually not that hard to solve, but for say a UPS or FedEx delivery truck driver who may have as many as 150 stops in a day - well that problem of math and logistics gets much, much more complex.  And, as the piece from Nautilus describes, the Traveling Salesman problem is not only incredibly important for transportation companies to try and solve, it becomes even more complex when we factor in the the delivery drivers are actual human beings, and not just parts of an equation on a whiteboard.

    Check out this excerpt from the piece to see how one (unnamed) delivery company is taking HR and workforce data, couples with the realization that indeed, people are a key element,  and baking it in to the classic math problem of the Traveling Salesman:

    People are also emotional, and it turns out an unhappy truck driver can be trouble. Modern routing models incorporate whether a truck driver is happy or not—something he may not know about himself. For example, one major trucking company that declined to be named does “predictive analysis” on when drivers are at greater risk of being involved in a crash. Not only does the company have information on how the truck is being driven—speeding, hard-braking events, rapid lane changes—but on the life of the driver. “We actually have built into the model a number of indicators that could be surrogates for dissatisfaction,” said one employee familiar with the program.

    This could be a change in a driver’s take-home pay, a life event like a death in the family or divorce, or something as subtle as a driver whose morning start time has been suddenly changed. The analysis takes into account everything the company’s engineers can think of, and then teases out which factors seem correlated to accident risk. Drivers who appear to be at highest risk are flagged. Then there are programs in place to ensure the driver’s manager will talk to a flagged driver.

    In other words, the traveling salesman problem grows considerably more complex when you actually have to think about the happiness of the salesman. And, not only do you have to know when he’s unhappy, you have to know if your model might make him unhappy. Warren Powell, director of the Castle Laboratory at Princeton University’s Department of Operations Research and Financial Engineering, has optimized transportation companies from Netjets to Burlington Northern. He recalls how, at Yellow Freight company, “we were doing things with drivers—they said, you just can’t do that.” There were union rules, there was industry practice. Tractors can be stored anywhere, humans like to go home at night. “I said we’re going to need a file with 2,000 rules. Trucks are simple; drivers are complicated."

    Did you catch all the HR/talent/workforce data baked into the model described above?

    Payroll, time and attendance, life events that likely would show up in the benefits admin system, scheduling are all mentioned, and I bet digging deeper into the model we'd find even more 'talent' elements like supervisor or location changes, time since a driver's last compensation increase, and maybe even 'softer' items like participation in company events or number of unread emails in their inbox.

    The specifics of what bits of talent data aere being incorporated into the process matter less than the fact that in the example the HR data is being mashed up so to speak with the 'hard' data from the truck itself (which is another interesting story as well), and analyzed against past driver experiences to alert managers as to when and where an accident is more likely to occur.

    There is even more to the problem than the technical observations from the truck itself, and the alogorithms' assessment of the HR/Talent data - things like Union rules and contracts factor into the equation as well. 

    But for me, this example of taking HR data and using it not just to try and 'predict' HR events like involuntary turnover or a better or worse performance review score, and apply it to real business outcomes, (the likelihood of accidents) represents a great example of where 'Big Data for HR' is heading.

    I definitely recommend taking a few minutes this week to read the entire piece on the Nautilus site, and then think about some the next time the FedEx driver turns up with a package.

    Have a great week!
    Thursday
    May162013

    I've got some suggestions for your screenplay

    Not really, and unless you are up to something on the side, you probably don't even have a screenplay (or a short story or a book for that matter). But what you might have, still, is that problem of folks in the HR and even IT game have been lamenting just about forever - no 'real' business people take you all that seriously.

    For whatever reason the people in the organization that get to decide the 'what' of what people do are more important and 'strategic' than the people that (largely) are responsible for finding and hiring those people in the first place (HR), and identifying, procuring, deploying, and maintaining all the technologies that the people rely on every day (IT). That is probably true in most organizations and it's also true that it's unlikely to change unless HR and IT start to think a little differently about the problem.

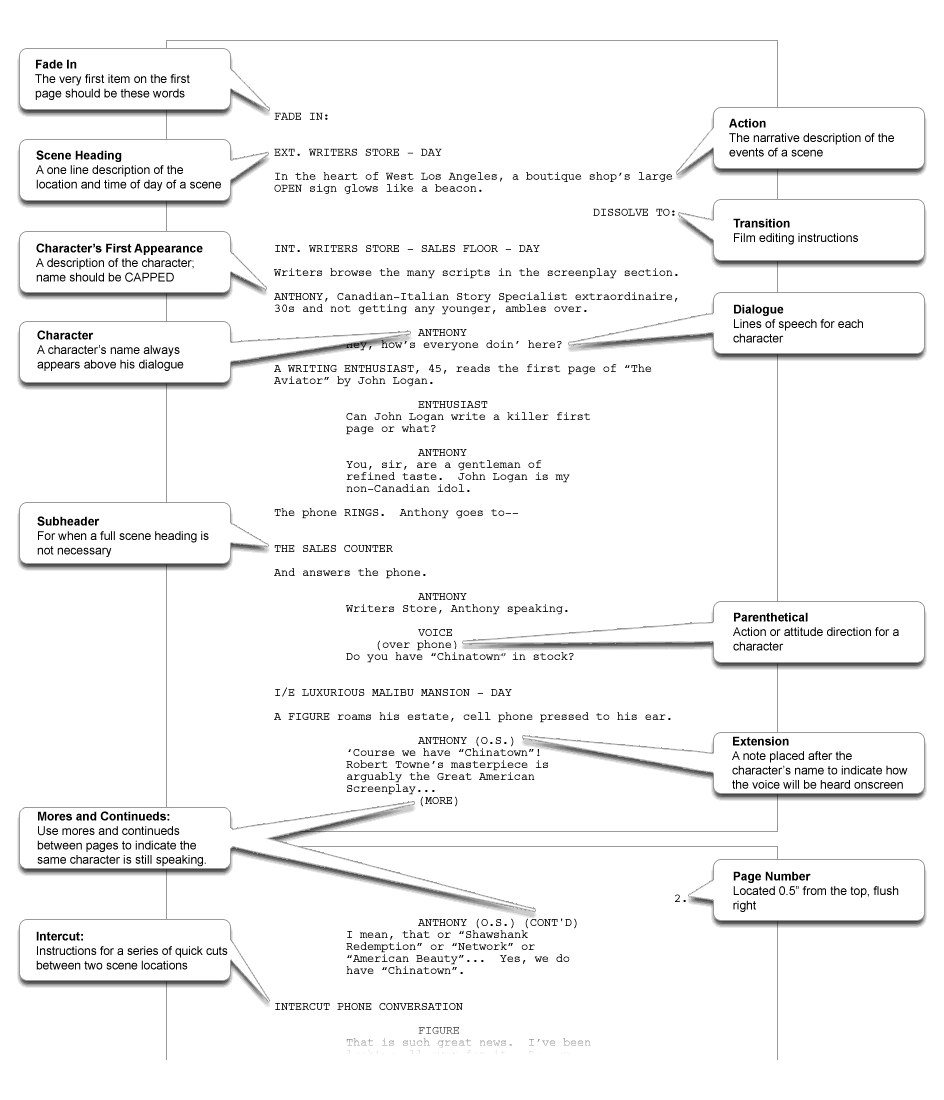
    I was thinking about this over the weekend when I read this piece in the New York Times, Solving the Equation of a Hit Film Script, With Data, about a new method or process where Hollywood film scripts are evaluated, and suggestions for improvement given, based on data-driven analysis. How does the process work? From the NYT piece:

    Netflix tells customers what to rent based on algorithms that analyze previous selections, Pandora does the same with music, and studios have started using Facebook “likes” and online trailer views to mold advertising and even films.

    Now, the slicing and dicing is seeping into one of the last corners of Hollywood where creativity and old-fashioned instinct still hold sway: the screenplay

    A chain-smoking former statistics professor named Vinny Bruzzese — “the reigning mad scientist of Hollywood,” in the words of one studio customer — has started to aggressively pitch a service he calls script evaluation. For as much as $20,000 per script, Mr. Bruzzese and a team of analysts compare the story structure and genre of a draft script with those of released movies, looking for clues to box-office success. His company, Worldwide Motion Picture Group, also digs into an extensive database of focus group results for similar films and surveys 1,500 potential moviegoers. What do you like? What should be changed?

    Pretty interesting and still in this age of data trumping everything kind of unusual. Although even as I recently wrote about here, data and algorithms and machine learning approaches encroaching on formerly 'creative' endeavors are starting to pop up more and more.

    Applying intelligence, Big Data, and more powerful technologies for improving movie screenplays does more than just fix up the dramatic scene in Act III, it allows a guy like Vinny Bruzzese, who as far as we can tell had no 'real' movie experience, to become an influential participant in the movie-making process.

    His data, team of analysts, and statistically-backed conclusions and suggestions, now put him more and more 'at the table' (sorry), where formerly only writers and movie producers used to meet. It doesn't really matter that he didn't go to film school or he didn't spend the 80s directing episodes of Full House, his data-driven solutions make him a Hollywood player.

    Influence in business seems to be becoming more about who can gather, assess, and make data actionable, than who has the 'right' degree or experience. And the background of the people who can do that might be a lot different than who normally used to have that kind of influence. 

    Tuesday
    May142013

    HR map of the day - time to widen your circle

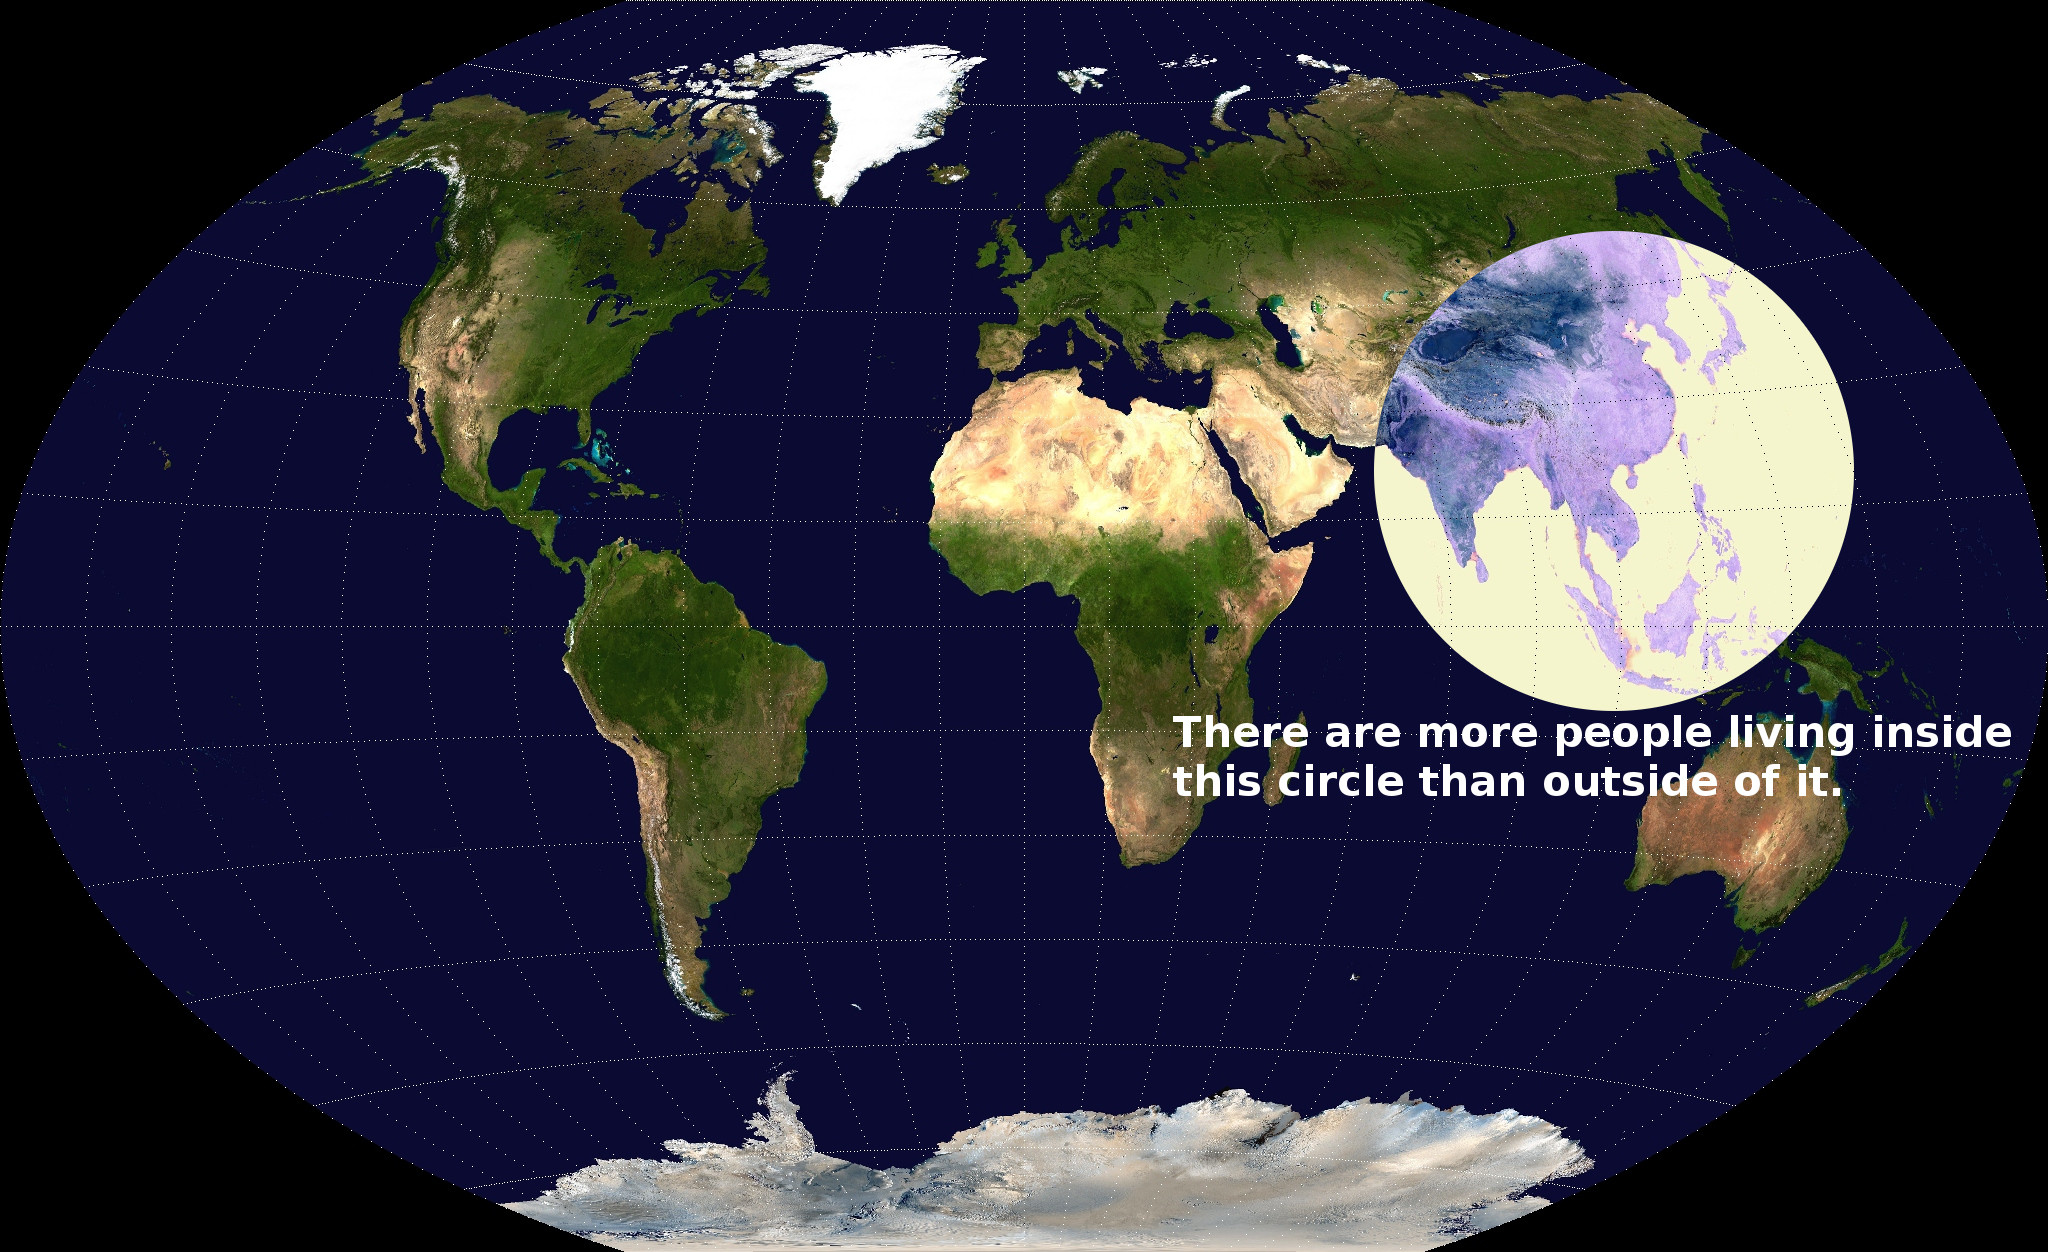
    The map below, initially posted by Reddit user valeriepieris, made the internet rounds last week, so perhaps you've seen it. Or perhaps not, as we seem often in the HR online space (me included), debating about cultural fit and performance reviews and the difference between SaaS and hosted applications, and other such nonsense, when chances are at least more likely information like in the map below will have a more profound and significant impact on our businesses in the next decade.

    So here is the map, and then we can discuss what, if anything this should mean to those of us in the Talent game.

    So for the US-based Talent pro, this might be kind of surprising, I know it was surprising to me. We know that the world is supposed to be shrinking, but in a way this map doesn't really bear that out. Rather it shows pretty simply that the center of population is on the other side of the world, and packed into a relatively small area. 

    So what might this mean, or what might you need to be thinking about with this map in mind?

    If you are an older, established company that is having a hard time finding opportunities for growth in your domestic market, then if you are not looking to play inside the circle in some way - then you are effectively cutting out half of the world's population and potential customers.

    If you are a newer Talent pro, then chances are sometime in your career you will either need to understand the talent pools inside the circle, or perhaps even have to spend some time working inside the circle yourself. Maybe not today or tomorrow, especially if your shop is in some kind of truly local business. But do you really think you will be working there forever? No time like the present to start preparing for both of those possibilities. 

    Last, if you are a parent, or perhaps plan to be a parent one day, this map is just another representation of the fact that the world our children will inherit and have to make their way in will be substantially different than it was even one generation ago. That has probably been true of all generations, but that doesn't give you a pass to ignore what is happening in the world today and to think about how best all of us should be preparing those rock and roll loving young whippersnappers.

    So take a look at the map, think about (at least for a few minutes), what it might mean for you. Then, if you must, resume tweeting about how companies need to be more social and how employee engagement is good. 

    Somehow, I think all that stuff will mean very little when compared to some of the really big changes happening in the world.


    Note: If you need or care about the rough population estimates that back up this conclusion here they are:

    World pop: 7+B, so the circle must have more than 3.5B people in.

    China pop: 1.33B
    India pop: 1.25B
    Indonesia pop: 0.25B
    Japan pop: 0.13B
    Thailand pop: 0.07B
    Bangladesh pop: 0.14B
    Pakistan pop: 0.19B
    Malaysia pop: 0.03B
    Philippines pop: 0.095B
    South Korea pop: 0.04B

    Total from above: 3.524B
    Thursday
    Apr112013

    #HRHappyHour 160 PODCAST - 'Data, Technology, and Insight'

    Earlier this week myself along with HR Happy Hour Show co-host Trish McFarlane pre-recorded a special HR Happy Hour Show with Dann Adams, the President of Equifax Workforce Solutions, a division of the large data and services company Equifax, that you might know from their work with credit scores.

    You can listen or download the show from the show page here, on iTunes, (just search the iTunes store for 'HR Happy Hour'), and from the replay widget below. But if you MUST have that 'live' HR Happy Hour Show experience, the show will automatically replay at 8:00PM ET tonight on the replay show page here.

    Listen to internet radio with Steve Boese on Blog Talk Radio


    It was a great and really interesting conversation with Dann about how data, and in particular employment data, (the kind that Equifax Workforce Solutions specializes in), can be harnessed by organizations to make better decisions, to actually help employees and their well-being, and gain insights into organizational talent strategies. 

    We talked about a lot of subjects you might not think 'fit' into an HR conversation - about the genesis, purpose, and limited (at times) value of credit scores, about how the growing mountain of student loan debt is influencing hiring and retention strategies, how getting financing for a car is going to start changing soon, and how data privacy continues to be top of mind for individuals and organizations.

    If you're interested in Big Data in HR and in learning some ways in which a better understanding of that data - combined with a new and emerging set of analytics and visualization tools to make that data accessible and relatable, then you should definitely check out the show/podcast.

    HR Happy Thursday!