Quantcast
Subscribe!


Enter your email address:

Delivered by FeedBurner


E-mail Steve
This form does not yet contain any fields.

    free counters

    Twitter Feed

    Entries in statistics (7)

    Thursday
    Jun152017

    Learn a new word: Positive Predictive Value

    Predictive analytics and the application of algorithms to help make 'people' decisions in organizations has been a subject of development and discussion for several years now. The most common applications of predictive tech in HR have been to assess and rank candidates for a given job opening, to estimate an individual employee's flight risk, and to attempt to identify those employees with high potential or are likely to become high performers.

    These kinds of use cases and others and the technologies that enable them present HR and business leaders with new and really powerful tools and capabilities that can, if applied intelligently, provide a competitive edge realized from the better matching, hiring, and deploying of talent.

    But you probably know all this, if you are reading an HR Tech blog anyway, and perhaps you are already applying predictive HR tech in your organization today. But there is another side or aspect of prediction algorithms that perhaps you have not considered, and I admit I have not really either - namely how often these predictive tools are wrong, and somewhat related, how we want to guide these tools to better understand how they can be wrong.

    All that takes us to today's Learn a new word - 'Positive Predictive Value (PPV)'

    From our pals at Wikipedie:

    The positive and negative predictive values (PPV and NPV respectively) are the proportions of positive and negative results in statistics and diagnostic tests that are true positive and true negative results, respectively. The PPV and NPV describe the performance of a diagnostic test or other statistical measure. A high result can be interpreted as indicating the accuracy of such a statistic.

    A good way to think about PPV and NPV is using the example of an algorithm called COMPAS which attempts to predict the likelihood that a convicted criminal is likely to become a repeat offender, and has been used in some instances by sentencing judges when considering how harshly or leniently to sentence a given criminal.

    The strength of a tool like COMPAS is that when accurate, it can indicate to the judge to give a longer sentence to a convict that is highly likely to be a repeat offender, and perhaps be more lenient on an offender that the algorithm assesses to be less likely to repeat their crimes once released.

    But the opposite, of course is also true. If COMPAS 'misses', and it sometimes does, then it can lead judges to give longer sentences to the wrong offenders, and shorter sentences to offenders who end up repeating their bad behaviors. And here is where PPV really comes into play.

    Because algorithms like the ones used to create COMPAS, and perhaps the ones that your new HR technology uses to 'predict' the best candidates for a job opening, tend to be more or less wrong, (when they are wrong), in one direction. Either they generate too many 'matches', i.e., recommend too many candidates as likely 'good hires' for a role, including some who really are not good matches at all. Or they produce too many false negatives, i.e. they screen out too many candidates, including some that would indeed be good fits for the role and good hires.

    Back to our Learn a new word - Positive Predictive Value. A high PPV result for the candidate matching algorithm indicates that a high number of the positives, or matches, are indeed matches. In other words, there are not many 'bad matches' and you can in theory trust the algorithm to help guide your hiring decisions. But, and this can be a big but, a high PPV can often produce a high negative predictive value, or NPV.

    The logic is fairly straightforward. If the algorithm is tuned to ensure that any positives are highly likely to truly be positives, then fewer positives will be generated, and more of the negatives, (the candidates you never call or interview), may have indeed been actual positives, or good candidates after all.

    Whether it is a predictive tool that the judge may use when sentencing, or one your hiring managers may use when deciding who to interview, it is important to keep this balance between false positives and incorrect negatives in mind.

    Think of it this way - would you rather have a few more candidates than you may need get screened 'in' to the process, or have a few that should be 'in' get screened 'out', because you want the PPV to be as high as possible?

    There are good arguments for both sides I think, but the more important point is that we think about the problem in the first place. And that we push back on any provider of predictive HR technology to talk about their approach to PPV and NPV when they design their systems.

    Monday
    May222017

    Learn a new word: The Optimal Stopping Problem

    I caught an interview over the weekend with one of the authors of Algorithms to Live By (can't recall which of the two co-authors I heard, but it doesn't matter. Kind of like it doesn't matter which of the two guys in Daft Punk plays a particular instrument on any given track. But that is another story.), and wanted to share a new word I learned from the interview that has some relevance to HR/Recruiting.

    For this installment of Learn a new word I submit The Optimal Stopping Problem.

    From our pals at Wikipedia:

    In mathematics, the theory of optimal stopping or early stopping is concerned with the problem of choosing a time to take a particular action, in order to maximise an expected reward or minimise an expected cost. Optimal stopping problems can be found in areas of statistics, economics, and mathematical finance (related to the pricing of American options). A key example of an optimal stopping problem is the secretary problem. Optimal stopping problems can often be written in the form of a Bellman equation, and are therefore often solved using dynamic programming.

    I bolded the 'secretary problem' which, despite its dated-sounding kind of name, is the example most commonly cited when discussing optimal stopping, and as luck would have it, is directly tied to HR/Recruiting.

    The secretary problem is essentially, the question of 'Given X number of job candidates for a given position, and also given you have to make a 'hire/decline' decision on each candidate before moving to the next one, how many candidates do you need to interview in order to maximize your probability of identifying the best candidate, while minimizing the risk of making a 'bad' hire, (say by waiting too long, rejecting too many candidates, and having to settle for a candidate that is left).

    Let's say you have 10 candidates for a position. You probably wouldn’t offer the job to the first candidate you interview, because you have no idea how that candidate compares to anyone else, or the general caliber of the candidates overall . But you probably don't want to wait until the 10th candidate, because if they’re the only one left you’re going to be forced to offer them the job (or keep it unfilled), regardless of how strong a candidate they are. Somewhere in the middle of the process there must be an ideal place to stop interviewing more candidates just to see what they’re like, and make a selection. But where to stop?

    Enter the Optimal Stopping Problem. You can dig into the math here, but it turns out there is an ideal place to stop interviewing candidates, (or dating different people in order to try and choose who to marry), and it's after you have interviewed (or dated), 37% of the contenders. After you get to 37%, make a note of the 'best' candidate you have seen so far, (let's call her Mary Jane). Then, continue interviewing candidates and when you find the first one that is 'better" than Mary Jane, stop all further interviews and immediately offer that person the job.

    How it works is related to the math behind estimating where the best candidate could be in the lineup. This number, expressed as 1/e, where 1/e eventually approaches 0.368, or about 37%. By analyzing the possible distribution of talent, it also turns out that if you interview the first 37 percent of candidates then pick the next one who is better than all the people you’ve interviewed so far, you have a 37 percent chance of getting the best candidate. 

    It's a really interesting way of looking at the hiring decision making process, (as well as other processes that involve trying to make the 'best' choice amongst a number of alternative). But it makes sense somehow, even if only on an anecdotal level.

    How many times have you slogged endlessly through an interview process where after some point candidate after candidate seem the same, and certainly no better than one you saw two weeks ago?

    Or how many of us have, (maybe even privately), thought about a past boyfriend or girlfriend that 'got away' and for some reason has never been eclipsed by the series of people that you have subsequently dated?

    Knowing when to stop, and understanding the probability that you have seen the best, or close enough to it, in any decision process is an enormously valuable thing.

    In the secretary problem, and in probably a bunch of other problems too, the answer seems pretty clear - once you hit 37% you have seen enough, you won't learn much if anything else useful, and you know how to make your decision.

    It is easy to apply in a job vacancy with 10 candidates. 

    It is a little tougher to estimate just how many people you are willing/able to date in order to know when to apply the 37% cutoff.

    Have a great week!

    Monday
    Dec162013

    CHART OF THE DAY: On the Labor Force Participation Rate

    Lately whenever we get a new jobs report that shows the official unemployment rate continuing on its slow but steady decline (currently at 7%), we also have to consider the Labor Force Participation Rate, that is, the percentage of the working-age population that is either employed or is actively looking for work, and thus considered to be officially unemployed.

    As seen in the below chart, the Labor Force Participation Rate has declined to levels not seen in about 35 years or so, to about 63%. 

    Or said differently, the percent of people that are classified as actually being in the labor force, (either working or actively seeking work), has sunk to a level not seen since the late 1970s.

    Every time these figures are reported and repeated, there seems to be quite a bit of speculation around the causes of this decline. Just why are there relatively fewer participants in the labor force?

    Is it simply a matter of demographics as retirements of the first wave of baby boomers (now in their mid-to-late 60s) start to accelerate?

    Or are younger workers simply dropping out of the labor force due to the frustration of not being able to find work, either due to a simple lack of openings or having repeatedly failed to secure work in what is still an extremely competitive job market?

    The underlying reasons for this drop in participation do matter I think, as they can be used to more effectively create policies and programs to address them, (if that is needed), as well as for HR and talent pros that might need to understand these trends and include them as an input into their workforce planning process.

    Shigeru Fujita from the Federal Reserve Bank of Philadelphia recently published a research paper on the topic, titled On the Causes of Declines in the Labor Force Participation Rate, that attempts to break down the causes of these declines, and for anyone interested in the topic is well worth a read.

    In a nutshell, the paper concludes that about 65% of the decline in the Labor Force Participation Rate since year 2000, (roughly when the decline began), and 2013 are due to retirements and disabilities, both suggestive of the 'demographics' side of the declining labor force equation. Note that the 'retirement' portion of the decline only commences in about 2010, when the oldest boomers would be about 65 years old.

    Additionally, the paper also concludes that while there was a significant jump between 2007 and 2011 of 'discouraged' workers leaving the labor force, i.e. people that wanted to work, but simple gave up trying to find work, that all the declines seen in participation since 2012 are due to increased retirements and not increases in discouraged workers. These conclusions suggest that the lower labor force participation rate is really the new normal, at least for the short term.

    I know I am probably boring you to tears at this point, but I find this data, and the reasons driving the changes, really interesting. If you're organization is having a hard time finding the people you need for your opportunities, or has plans to grow or expand in any substantial way in the near future, then these macro labor force trends are worth considering.

    Once folks leave the labor force, it is really hard to get them to come back, whether they have retired, or have simply given up.

    Have a great week!

    Wednesday
    Jan302013

    'There isn't any more truth in the world than there was before the Internet'

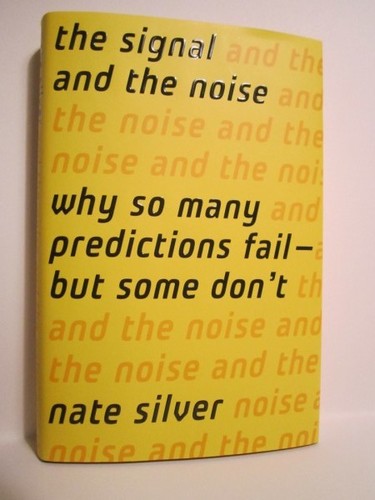
    I've been grinding through Nate Silver's book 'The Signal and the Noise' over the last few weeks and while it can, at times, get perhaps a little too deep into some dark statistical alleys, overall it is a fascinating read, and one I definitely recommend if for no other reason than for an excellent chapter on handicapping NBA basketball games.

    If there is one major theme or takeaway from the book for me, I think it is best articulated in this quote, about two-thirds of the way through the book, in a chapter about how difficult it can often be in making sense of data, a problem only getting worse as the amount and availability of data continues to explode:

    The US Government now publishes data on about 45,000 economic statistics. If you want to test for relationships between all combinations of two pairs of these statistics - is there a causal relationship between the bank prime loan rate and the unemployment rate in Alabama? - that gives you literally one billion hypotheses to test.

    But the number of meaningful relationships in the data - those that speak to causality rather than correlation and testify to how the world really works - is orders of magnitude smaller. Nor is it likely to be increasing at nearly so fast a rate as the information itself; there isn't any more truth in the world than there was before the Internet or the printing press. Most of the data is just noise, as most of the universe is filled with empty space.

    In 2013 I promise that you, as an informed, and opportunistic Talent professional will be hearing, seeing, talking, and thinking about Big Data. Data about job ad posting, data about talent assessment scores, data about compensation and retention, data about engagement, data about performance, and maybe even data about data. 

    As I wrote a couple of weeks ago, most organizations have plenty of data. More than they know what to do with. And the more they collect, as made really clear in the example above, the chances are high that it won't lead to a faster discovery of the truth - it will just unearth more paths to explore.

    Which sometimes, certainly, might be needed, but other times, and maybe most of the time, only results in more ways to get lost.

    Don't get caught up chasing data just to have more data. The truth isn't going anywhere, and once you think you have it figured out, and feel that the data you do have supports your beliefs, then you'd probably be better served acting, rather than collecting even more data. 

    Have you read The Signal and the Noise yet? Better get on it, just in case it becomes the 2013 version of Moneyball, and you won't want to feel left out!

    Tuesday
    Dec042012

    Protecting what isn't damaged

    It's World War II and your job is to help the military devise a strategy for reducing the shockingly high loss rate of planes in battle. Dozens and dozens of planes are being lost due to ground-based enemy anti-aircraft weapons, as well as in air combat.

    And of the planes that do make it back to their air bases safely, most have received at least some damage, with many of the damaged planes requiring substantial repairs to make them air-worthy again.

    You show up to the air base, and as you begin examining the damaged planes you make an interesting observation - most of the planes that made it back have sustained damage to the wings, fuselage, and fuel systems, but most do not exhibit signs of damage in the engines or front of the cockpits.

    A bunch of shot-up planes but a fairly consistent of measurable and repeatable characteristic - damaged fuselages but not engines. Wings that have sustained hits but with clean and intact cockpits.

    Your recommendation to the military brass to reduce the rate and number of lost planes?

    Well it seems intuitive that better armor and protection on the parts that have sustained the most damage would be the best strategy. I mean, you have evidence all around you - blown apart wings, fuel systems, etc. These parts are obviously sustaining heavy damage in battle, and need shoring up.

    Makes sense, right?

    Except that it is almost completely wrong, and due to the research and conclusions made in WWII by Abraham Wald, the opposite of the best strategy.

    Wald concluded that the Air Force shouldn't arm or add protection to the areas of the planes that sustained the most damage on the ones that came back. By virtue of the fact that they planes came back at all, those parts of the planes could sustain damage.

    Wald's insight, that the holes from flak and bullets on the bombers that did return represented the areas where they were able to take damage led him to conclude that these patches were the weak spots that led to the loss of a plane if hit, and that they must be the parts to be reinforced. 

    Wald's suggestion an recommendation seemed unconventional, but only if you could get past what you could 'see', a bunch of blown apart wings and fuselages; and think about what you couldn't see, the planes that crashed as a result of the damage they sustained.

    The big lesson or takeaway from this tale?  As usual, probably not much of one, with the possible exception is that it serves as a compelling reminder not to always focus on the obvious, the apparent, and what seems like the easy explanation.

    Note - some of Wald's notes on this research can be found here.