Quantcast
Subscribe!


Enter your email address:

Delivered by FeedBurner


E-mail Steve
This form does not yet contain any fields.

    free counters

    Twitter Feed

    Entries in chart (85)

    Friday
    May052017

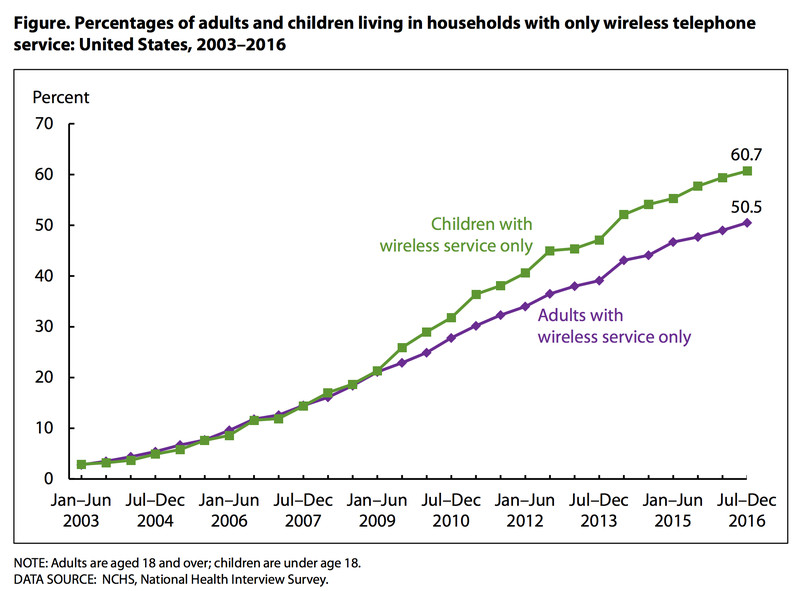
    CHART OF THE DAY: The Decline of the Landline

    Really interesting data from your pals at the National Center For Health Statistics on the long, slow but seemingly irreversible decline of the home landline phone. Turns out, if you have dropped your landline to go mobile only, you are not all that odd any longer.

    Here's the data and as you constantly demand, some FREE comments from me after the chart.

    Some really interesting data for sure. The key points or takeaways for me:

    1. More folks than not have ditched the home landline. Just over 50% of households are now mobile only. Pretty soon it will be kind of odd and weird to still have a landline. Additionally, more than 70 percent of adults between 25 and 34 were wireless only. 

    2. Being wireless only, as a majority of households are now, means, (as if you didn't know this), that our mobile phones are constantly powered on, are always within reach, and have become probably the most indispensable piece of technology we own. What could you go without with longer, your mobile phone or your car? Or your TV? Or your coffee maker? I might choose the coffee maker, but the car and the TV I would give up. Why not? I can request an Uber with my phone and stream the NBA playoffs on my phone. Once my phone can make coffee, well...

    3. Since the mobile phone is the most important piece of technology most of us use, then gaining 'share' of people's phpne time, no matter of you are in marketing, recruiting, sales, or even HR, is the most impactful thing you can do to advance your agenda. I would posit that at least half, if not more like 75%, of the efforts you are making to reach people should be focused on how you are reaching them on their mobiles. We all know this but when I see data about the usage and penetration rates of mobile technology for HR I am not so sure we are really applying what we know to be true. 

    Anyway, that's it for me. I'm out, have a great weekend!


    Monday
    Mar202017

    CHART OF THE DAY: More on the increasing 'Quits' data

    Quick shot for a busy 'Can you believe my Gamecocks are in the Sweet 16?' kind of a Monday.

    Here's just one chart from the latest release of what regular readers recognize as my favorite labor marker report - the Job Openings and Labor Turnover Survey - aka the 'JOLTS' report. 

    This chart illustrates the amount of 'Quits'  better known in HR speak as Voluntary Separations, compared with the amount of Layoffs and Discharges, AKA, 'Pack your things, son, it's time for you to go' deals.

    Here's the latest chart of this data, then as we all have come to expect by now, some FREE comments from me:

    Three quick observations...

    1. Really interesting right now that these two lines continue to get farther apart, and the gap between Quits and Layoffs/Discharges continues to increase. The delta between the two series is now 1.6 million, with Quits hitting 3.2 million in January, against 'only' 1.6 million Layoffs/Discharges.

    2. The continuing increased in the level of Quits is generally seen as a proxy measure for the overall health of the labor market. The thinking goes that when employees feel more confident in their ability to find alternative work, (either at another company or for themselves), then they are more likely to 'quit' the job they have now. It is a seller's market for labor in some sense. 

    3. If this trend continues, and labor markets continue to tighten, (you can also look at total job openings to get a sense of this), then employers will (according to the immutable laws of supply and demand), be forced to take counter measures. They can either look to reduce 'quits' by raising wages, improving benefits, or striving to become less crappy places to work. Or, they can look to alternate sources of labor - offshoring, outsourcing, automating, etc., in order to find the talent/labor they need.

    The slow and steady economic recovery since the bottom of the last recession marches on. Unless something changes relatively soon, 2017 is shaping up to be a good year for folks who are in demand, have negotiating leverage, and are feeling as confident as ever in their ability to control their careers.

    Have a great week! 

    Go Gamecocks!

    Monday
    Mar062017

    CHART OF THE DAY: The World Economy in One Chart

    You may have seen this chart passed around a week or two ago when it was published on Visual Capitalist, but as I was digging through my 'Read Later' pile over the weekend I felt like it was too good and interesting not to share.

    So without further delay,  visual look at the global economy, represented by country contribution to global GDP, and then as you DEMAND, some free comments from me after the data.

    (Email and RSS subscribers may need to click through to see the chart, and clicking on the chart will bring you to a much larger version)


    Courtesy of: Visual Capitalist


    Really interesting and cool chart, right? Three quick observations from me about what 'normals' like us should be thinking about when looking at the data.

    1. Go USA! Ok, not trying to be too much of a cheerleader here. But while many other economies (namely China, but I will get to that in a second), have emerged on the world stage in the last twenty or thirty years, the USA still accounts for a shade under a quarter of World GDP. This is important for organizations, particularly US-based or centric organizations to remember even as they make their plans for international expansion. It probably would be a mistake to concentrate too much time and energy on markets that either are relatively small, (say the Netherlands or Spain), or not expected to grow as rapidly in the next ten years, (Germany or the UK).

    2. Don't sleep on China, (and to a lesser extent Japan and India). I know that it can be hard for many US businesses to wrap their minds around places like China and Japan. It is hard to to business there. The language and cultural barriers are more significant than say in Western Europe. It may take longer to establish a presence there. But make no mistake, future growth is being defined by what is happening in Asia - not in Western Europe. It may take a little more time, but the organizations that can make the investments, get in front of their competition, will be better equipped to capitalize in the parts of the world that are growing the fastest. 

    3. Perspective is really the biggest takeaway from a chart like this I think. We can, here in the US, get really full of ourselves,(see above), and it is a good reminder that even as the largest economy, more than 75% of economic activity is happening elsewhere. Insert your own country in the above sentence and the percentages get even more sharp. Places that we think of as economic leaders like Germany and the UK contribute less than 5% each to global GDP, while seemingly set up for being surpassed soon by places like India and South Korea. None of us are all that big a deal.

    Anyway, that's it from me for a busy Monday - have a great week!

    Friday
    Feb172017

    CHART OF THE DAY: Report from Startup Land

    I don't like to get too caught up in tracking and detailing the latest trends and moves in HR, Talent, or even workplace technology emanating from Silicon Valley. After all, the vast majority of us do not work in go-go startups, can't really empathize with most startups particular challenges, and the rules of engagement for HR and talent leaders at 30 year-old manufacturing companies with 2,600 employees are naturally, (obviously), different than at a new 12-person 'Uber for XYZ' startup in Palo Alto.

    But on the other hand if you generally believe that innovation in technology, service delivery, and even 'HR' things like benefits, workplace design, and employee experience does often start at 12-person 'Uber for XYZ' startups, as they are unencumbered by size, tradition, understanding of the 'rules', and simply often too busy to worry about HR things and just get to work, then keeping an eye on what is happening in the Valley can be a useful exercise for any HR and talent pro - no matter what size and type of organization you are in.

    One recently published set of snapshots on what is happening in Startup Land comes to us from Silicon Valley Bank in the form of their 2017 Startup Outlook Report (US).  It is a really interesting look at some of the trends, challenges, and points of view from their survey of leaders of 941 global startups, 62% from the US. I want to share three charts from the US portion of the report, with a comment or two for each, then send you on your way for the (long) weekend.

    Chart 1 - The 'War' for Talent

    You'd expect that a majority of startups would report difficulty in finding the people they need to grow their businesses since many of these startups are in technology fields where the tech itself may be new, and the competition for people with these often very hard to find skills is fierce. But 90% plus saying it is challenging or extremely challenging to find talent? I must say that even surprised me. Even though the percentage ticked down a bit, 9 of 10 startup leaders showed up to work today probably worried about finding talented people.

    2. Gender diversity is not improving

    While it probably is not surprising that most startups have mostly male leaders and mostly male boards of directors, what is at least a little surprising, given the increased attention on this issue in the last year, is that surveyed startups are getting more male at the leadership and board levels.  Buried behind this chart is the note that about a quarter of surveyed firms have formal programs in place to increase female representation in leadership roles. But a quick look at the above data suggests that these efforts are not moving the needle at all.

    3. Despite it all, almost all of these startups are hiring

    It is the nature of a startup to grow and hire, so you'd expect these numbers of firms looking to increase headcount in 2017 to be high, but it is pretty encouraging to see that this number has remained consistently high over the last few years. And this is really good news for the kinds of people that these startups are likely to be after - highly skilled, proficient in the latest technology, and able to add value right away. There's a reason why 'Data Scientist' is sometimes called the best job in America today. Although I'd argue that 'Stretch Four' would be better. Non basketball fans, Google that one.

    Lots of other interesting data points in the 2017 Startup Outlook Report - I encourage taking a few minutes to read it through. You might not be an HR pro at a Valley startup, but you just might be competing with some of them for your next Data Scientist.

    Have a great weekend!

    Wednesday
    Feb012017

    CHART OF THE DAY: Piles and piles of cash

    Lots of noise and stress lately that comes from a political transition and in this case a transition to a philosophy that is a dramatic departure from at least the last eight years, (if not longer). I did my one and only (I promise) take on the most controversial happenings (so far), on Monday, but I wanted to hit one more quasi-political issue, but also one that impacts work, business, and potentially jobs.

    Namely, the staggering amounts of cash that many of the largest American firms are holding, and in particular, the increasing levels that these firms have 'parked' in overseas accounts (ostensibly to avoid paying US corporation income tax on the funds). 

    Here's a reasonably recent chart (from last September) showing some of the larger companies and overseas cash piles, (courtesy of CNBC), then some comments for me after the data.

     Three quick takes on this stockpile of overseas cash (and large cash reserves by corporations in general)

    1. American companies are holding about $2.5 Trillion (that is with a 'T') in overseas cash, which is more that 10% of the US annual GDP. Tack on the close to $2.0 Trillion, (that is another 'T'), in cash that US companies are holding domestically, you have about $4.5T in cash that is essentially doing nothing to build business, increase investment, hire more people, etc. Lots and lots of arguments for why this is the case, (not all of them political in nature), but I think we all can agree that this tremendous cash hoard represents untapped potential for growth.

    2. The main reason that American companies cite for parking so much cash overseas is the relatively high US corporate tax rate of 35%. It is by most analyses the highest corporate rate among developed economies. So when you combine a high tax rate, an additional surplus of domestic cash for many large companies, and still low by historical standards borrowing costs, many of the largest US companies are content to sit and wait and stare at their cash piles.

    3. Finally, many economists predict that a lowering of tax rates and a surge in repatriation of corporations overseas cash probably would not spur the kind of economic stimulus that many expect. Many of these firms would use substantial portions of this cash on stock buyback programs and increases in their dividend rate. These actions primarily benefit shareholders rather than the broader economy. Besides, some argue, if these companies had better ideas to invest this cash (new facilities, R&D, hiring more people, etc.), they would just do that.

    Sure, I know that most organizations, particularly smaller ones, would love to have the problem of not being able to figure out what to do with all their excess cash laying around. But all this cash is certainly not a great sign for longer term economic growth, increased innovation, and enhanced employment opportunities.

    It is going to be interesting, if a little wonky, to keep an eye on corporate tax rates, repatriation deals, and just what ends up happening to these Trillions in the next few years. I suspect that whatever happens, it will have a pretty significant impact on US GDP, growth, employment, and more.

    Happy February.