Quantcast
Subscribe!


Enter your email address:

Delivered by FeedBurner


E-mail Steve
This form does not yet contain any fields.

    free counters

    Twitter Feed

    Entries in chart (85)

    Tuesday
    Aug042015

    CHART OF THE DAY: Surging Investments in HR Tech

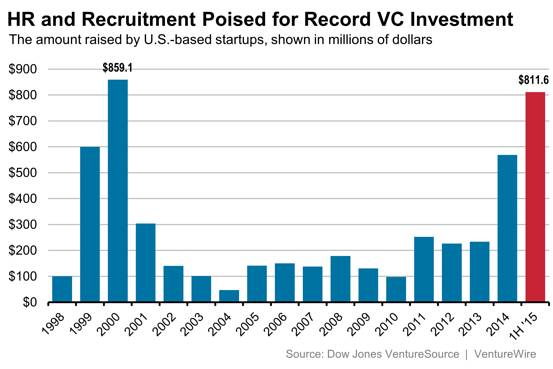
    Really a simple and self-explanatory Chart of the Day for a busy Tuesday, this one courtesy of the Wall St. Journal. Take a look at the chart of venture capital investment in the HR and Recruiting technology market from 1998 to the present, and as you expect and demand, some FREE commentary from me after the data.
    Some quick takes:

    1. First, to level set, the first half of 2015 with investment of about $811M is almost greater than the highest-ever yearly total of $859M back in 2000. Ah, 2000. The 'dot-com' era.  Good times.  But looking at the data you could argue that the HR tech market for VC investment really did not recover from the dot-com crash until very recently, like last year. So it could be that a prolonged period of under-investment is partially to account for the dramatic increases in 2014 and so far in 2015.

    2. Let's go ahead and assume that most VCs have plenty of options and opportunities for investment. If that is the case, then this windfall of money flowing into the HR tech space is good news for a large array of industry players - folks who can sell HR tech solutions, marketers, analyst firms, HR conferences, and even little 'ol bloggers like me, who have lots of products to see, think about, and potentially write about.  It is a sure sign of an industry that is primed for growth when the investment levels are surging upwards as we see in the WSJ. It's like the dot-com years all over again. At least let's hope we don't crash like we did from '02 - '04.

    3. What does this mean for the really important players in the HR tech market - the actual customers? Well in the broadest strokes it is mostly positive. More investment creates more competition which leads to better products and more customer choices. And while sometimes it seems like in HR tech that the bigger, more established players have gobbled up via acquisition many of the new entrants, I can assure you that judging from the number of HR tech startup demos I have been doing that there is no shortage of new ideas and innovation in the space.  This is a great time to be a customer of HR Tech, even if the market can be a little tricky to navigate.

    But like I said, good times all around - for the VCs, for the startups, and most importantly, for the customers and HR leaders who have access to an ever-expanding set of tools and technologies to help them improve results in their organizations.

    Tuesday
    Jul212015

    CHART OF THE DAY: Competition is global - at least one-third of it is

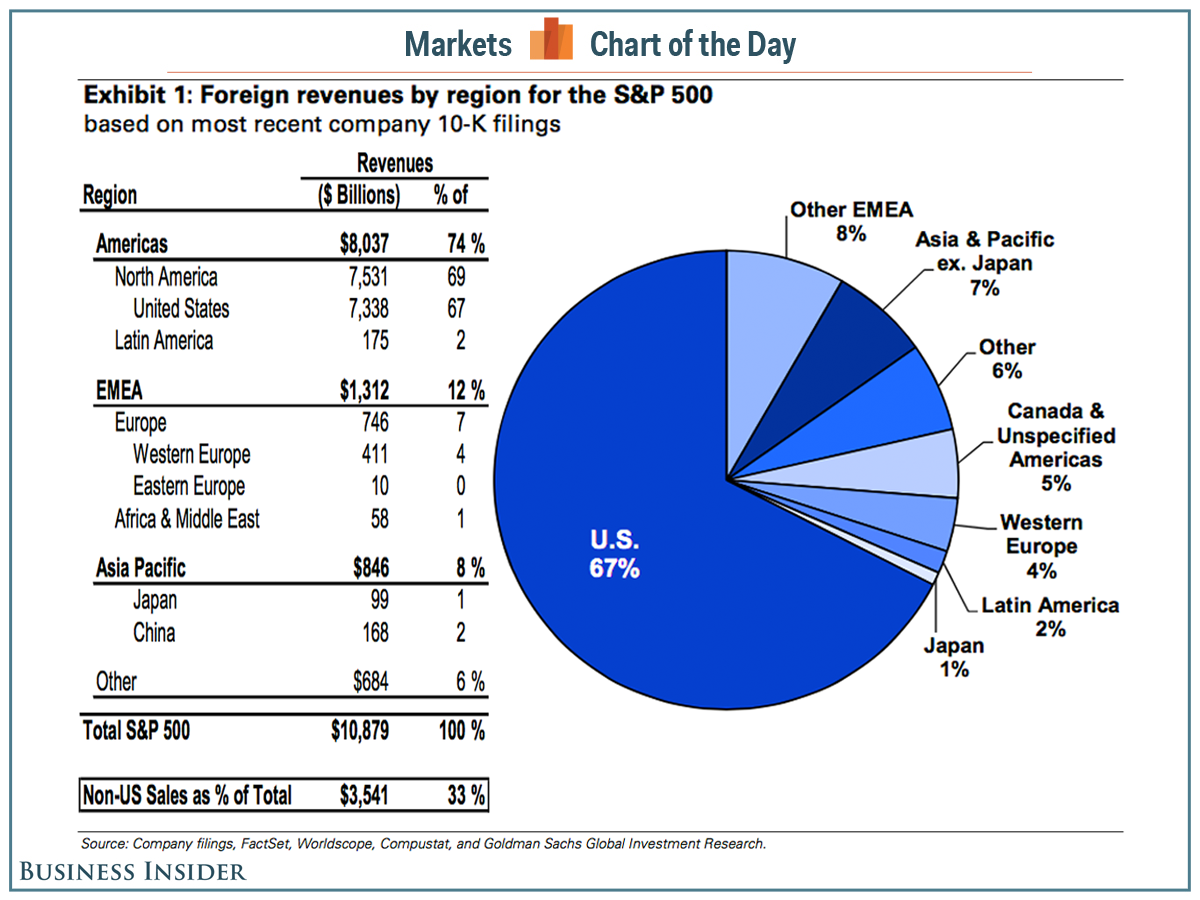
    Today's installment of the Chart of the Day series I think represents perfectly why I like to run these posts - it actually uses hard data to reveal the reality about a topic about which it can be really easy to sort of just accept without much research or questioning. 

    Quick - before looking at the data, try to take a stab at answering this question: In the modern, connected, networked, and global economy, about what percentage of revenues of large US-based companies (represented for the sake of argument by the members of the S&P 500), are earned from outside the USA?

    About half? Maybe more? I'm not sure, but I bet it is a lot?

    Let's look at the data, then a couple of quick, FREE observations from your pal. That is me.

    Some quick takes:

    1. It may be a little hard to read, so I will break out the important numbers. Total revenues earned outside the US by the members of the S&P 500 companies is about 33%, with the largest share of non-US revenues coming from EMEA, (12%), and APAC, (8%). I am not sure about you, but when I saw this data, I was really, really surprised still in 2015 how much domestic revenues dominate the mix in America's largest companies. I mean I feel like we have been hearing FOREVER how all competition is now global, and that in order to grow most companies have to look outside the USA. So while I do think that is still true, I was surprised by the extent to which neither of those things are really happening in a significant way.

    2. Having said that, your organization's best opportunities for growth may still be in the USA. If nothing else, these statistics reveal still how hard it is for US-based companies to compete in foreign markets. At least 25 years of attention to places like Asia and Europe still have not generated much more than about 10% of the S&P 500 companies revenues, respectively. If you are a smaller company, perhaps you should still keep your primary and secondary growth strategies focused on the domestic market, even if you feel like it is a tapped out. Upselling, expanding your target customer size, making adjacent market moves are all much, much easier on familiar territory than they are in one of the hundreds of places in the world who have no idea who you are.

    3.  It is more important to have diversified customers, no matter where they are, than customers all over the world. Reducing your organization's reliance on one market, even one the size of the USA, sounds like a smart strategy. But if the reality of the difficulty in cracking markets overseas makes the 'global' strategy too hard to execute, then domestic diversification is the next best, (maybe even the best) thing. It is more important to make sure that one or two massive customers don't represent half of your revenues than it is to worry that 96% of your total revenues come from inside the USA. 

    So that's my take, I found this data really interesting and surprising too. Would love to hear if you felt the same.

    Have a great Tuesday!

    Monday
    Jul062015

    CHART OF THE DAY: On Tesla and Disrupting Markets

    Quick question for a busy Monday - which auto maker have you seen the most reporting and commentary about in the last few years?

    Maybe General Motors - the largest US auto maker and who has been in the news plenty in recent years, mostly for a slew of recalls.

    Or possibly one of the major Japanese or Korean manufacturers like Toyoata or Hyundai that seem to be continually closing the gap in US market share from the traditional leaders, GM and Ford.

    No, I bet the auto maker you have read and heard the most about lately is the electric car maker Tesla, who for lots of reasons, (innovative products, charismatic leadership of Elon Musk, and interest in modern and ever cloud-based technology for cars), has garnered insane amounts of press and media coverage. 

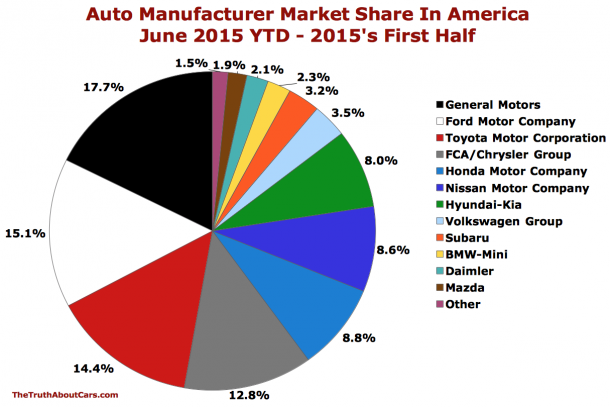
    So here is another question for you, and the subject of today's Chart of the Day - How much market share does Tesla actually have in the USA? Take a look at the chart below, courtesy of The Truth About Cars, then some quick comment from me. And as always, comments remain FREE.


    Some thoughts:

    1. So according to the chart for the first half of 2015 Tesla's USA market share is, well, we don't know what it is because on this chart Tesla does not actually register. They must be included in the 1.9% of 'Other'. 

    2. According to a similar data set over at Autonews.com, we see that for the first 6 months of 2015, Tesla sold about 10,200 cars in the US out of a total market of approximately 8.5 million vehicles.  So if my math is right, that puts Tesla's US market share for the first half of 2015 at 0.12%. That's a little bit more than a tenth of a percent. Other makers in the same general space in the market as Tesla include Maserati, Bentley, and SmartUSA.

    3. Here is why this is interesting to me, and where I think that there are some parallels to what we see in any technology market. There is a completely outsized focus on Tesla relative to their actual position in the market and one could argue, the market value of their business, when placing it in context. The pundits and the media, even what passes for the HR/Talent media, love, love, love to focus on the 'new' story, often at the expense of the most relatable story for their audiences. Chances are you have seen 1,493 stories about Tesla in the first 6 months of the year. Chances are also pretty good you don't know anyone that actually owns a Tesla.

    4. It is awesome in HR and Talent to think about what is next, what is likely to dominate how organizations are organized, how people are engaged, how workplaces will function in the future, but the truth is the vast majority of us, (and our leaders), have to think about the next 6 months of 2015, not what the world of work will look like a decade from now. It is important to think about this when reading about HR's version of Tesla, which of course is Zappos, and whatever new experiments they are running over there.

    5. Tesla probably is the most disruptive and innovative auto maker in the world, but the truth is the real impact of their disruptions won't be seen until they truly can deliver sufficient volumes of more mass-market cars, (Tesla's are $100K or so, high-end luxury cars today), and/or the big boys like GM or Toyota decide to try and compete more directly in this segment. It is the same in HR whether it is Holacracy or 'no resume recruiting' or 'no more performance reviews'. It takes a long time in mature industries for these disruptions to move past 'niche' and into the mainstream. Your challenge as an HR/Talent pro is to know when to move with the Teslas and Zappos of the world and when to lay back and lease the newest Camry. 

    Interesting stuff...

    Have a great week!

    Friday
    Jun122015

    CHART OF THE DAY: More open jobs today than since... well, since ever

    Not much to say about this data as I think it is more or less is self-explanatory.

    Courtesy of our friends at the Bureau of Labor Statistics and powered by the St. Louis Fed's awesome 'Fred' data service, take a look at the last 15 years or so of data on Total Job Openings in the US.

    A quick glance at the data tells us what we need to know: Job opening as of the end of April 2015 were about 5.4 million, and are at the greatest level in the history of this data set, surpassing the previous high mark in January 2001.

    There's lots and lots of opportunity out there. And I will bet lots of said opportunities are not the ones that like to hassle their opportunity holders about unfiled time sheets, and sick leave accruals, and bereavement leave, and having to 'check in' when they are out on vacation. 

    The labor market continues to get tighter. People have more options. And the organizations that are slow to realize this will probably, eventually regret their ignorance or arrogance.

    Have a great weekend!

    Tuesday
    Jun022015

    CHART OF THE DAY: Which job candidate gets the most attention from hiring managers?

    Quick answer - It is Candidate #4.

    Some back story on that conclusion...

    Recently researchers at Old Dominion University published a study called 'How quickly do interviewers reach decisions? An examination of interviewers' decision-making time across applicants' in the Journal of Occupational and Organizational Psychology. They found that hiring manager decision-making takes closer to five minutes for the first interviewee, and reaches closer to eight minutes by the fourth applicant. After this, however, the time hiring managers take to reach a decision begins to decrease with each additional interview.

    Here's a chart from the study:

    From the researcher's conclusions on this data:

    Interviewers tend to take longer to evaluate applicants near the beginning of their interview schedule and take less time to evaluate applicants near the end of their schedule. This may prevent applicants who appear later in the schedule from having a full opportunity to perform. Organizations may benefit from limiting the number of interviews an interviewer conducts in immediate succession to around four, which may decrease reliance on more automatic information processing strategies.

    What conclusions can we draw from this data, and what changes might we need to consider to make sure we are not falling into the 'Candidate #4' trap?

    Well, the first step is just being aware of this potential tendency. If you have to set up an interviewer or a hiring manager for a day-long set of candidate interviews, make sure you schedule some breaks such that they are not seeing a dozen people in a three-hour block. Chances are everyone after Candidate #4 are not getting a fair look, and we are wasting hiring manager time as well. 

    Next, if you are brining in a smaller set of short listed candidates for a second round of interviews, don't slate them in the same order with every interviewer they have to meet. Mix up the order across the interviewing team to try and reduce the effects of 'interview fatigue' adversely impacting any single candidate.

    And last, keeping this data in mind should make us be more careful about tracking more data around interviewing and interviewers - how much time they spend per candidate, how much does the 'Candidate #4' efffect exist in the organization, and how can we use data on these processes to get better.

    Data is our friend. Use wisely.